

Question: Sampling and Sampling Distribution Can you please do the additional activity. Additional Activity: Form a group of six members from your family/relatives. Get the weight
Sampling and Sampling Distribution
Can you please do the additional activity.
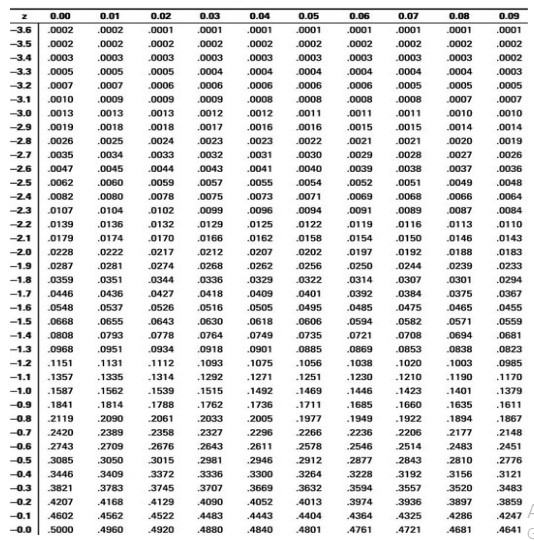
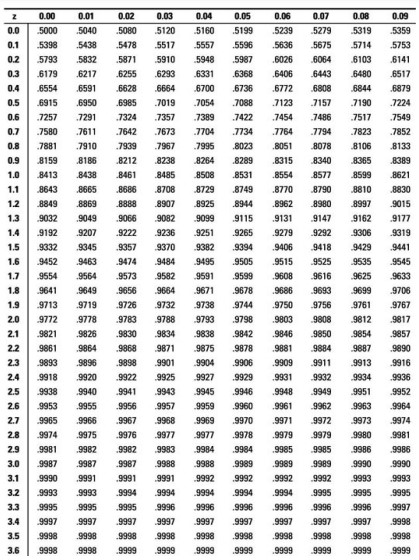
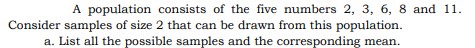
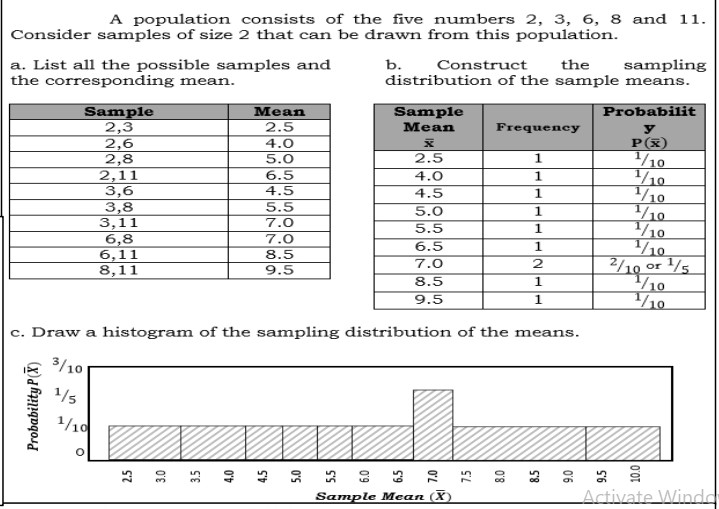
Additional Activity: Form a group of six members from your family/relatives. Get the weight of each member of the group. Consider samples of size 4 that can be drawn from this population. 1. How many possible samples can be drawn? 2. List all possible samples and the corresponding means. 3. Construct the sampling distribution of the sample means. 4. Draw the histogram for the sampling distribution of the sample means. STANDARD NORMAL PROBABILITIES The table entry for z is the area under the standard normal curve to the left of z. Number in the table represents n\fSTANDARD NORMAL PROBABILITIES The table entry for z is the area under the standard normal curve to the left of z. Number in the table represents P(ZS z) 2\fA population consists of the five numbers 2, 3, 6, 8 and 11. Consider samples of size 2 that can be drawn from this population. a. List all the possible samples and the corresponding mean.A population consists of the five numbers 2, 3, 6, 8 and 11. Consider samples of size 2 that can be drawn from this population. a. List all the possible samples and b. Construct the sampling the corresponding mean. distribution of the sample means. Sample Mean Sample Probabilit 2,3 2.5 Mean Frequency 2,6 4.0 P(X) 2,8 5.0 2.5 1 1/10 2,1 1 6.5 4.0 1 1/10 3,6 4.5 4.5 1 1/10 3,8 5.5 5.0 1 1/ 10 3,1 1 7.0 5.5 1 1/10 6,8 7.0 6,11 8.5 6.5 1 1/ 10 8,1 1 9.5 7.0 2 2/10 or 1/5 8.5 1 1/10 9.5 1 1/10 c. Draw a histogram of the sampling distribution of the means. 3/10 1/5 Probability P(X) 1/10 8 8 2 10. Sample Mean (X) Activate Wind
Step by Step Solution
There are 3 Steps involved in it

Get step-by-step solutions from verified subject matter experts