

Question: Sampling from a distribution. Use the Python libraries numpy and =atplotiib. (a) Draw 100 samples x=[x1x2} from a 2-dimensional Gaussian distribution with mean [0,0} and
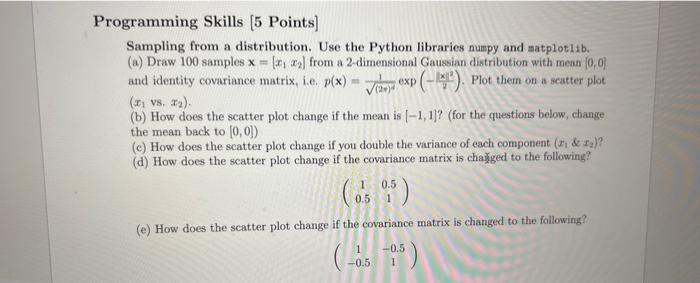
Sampling from a distribution. Use the Python libraries numpy and =atplotiib. (a) Draw 100 samples x=[x1x2} from a 2-dimensional Gaussian distribution with mean [0,0} and identity covariance matrix, i.e. p(x)=(2)41exp(2x2). Plot them on a scatter plot (x1, v8, x2). (b) How does the scatter plot change if the mean is [1,1] ? (for the questions below, change the mean back to [0,0] ) (c) How does the scatter plot change if you double the variance of each component (x1&x2) ? (d) How does the scatter plot change if the covariance matrix is charged to the following? (10.50.51) (e) How does the scatter plot change if the covariance matrix is changed to the following? (10.50.51)
Step by Step Solution
There are 3 Steps involved in it

Get step-by-step solutions from verified subject matter experts