

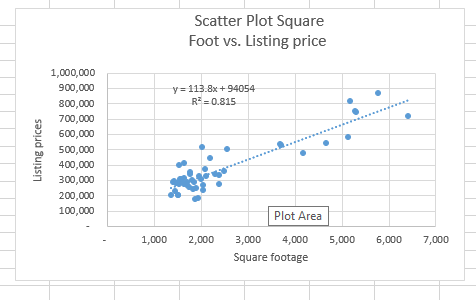
Question: [Sampling the data: Identify your predictor and response variables.][Scatterplot: Create and insert a correctly labeled scatterplot of your predictor and response variables to ensure they
[Sampling the data: Identify your predictor and response variables.][Scatterplot: Create and insert a correctly labeled scatterplot of your predictor and response variables to ensure they are appropriate for developing a linear model.]
Step by Step Solution
There are 3 Steps involved in it
1 Expert Approved Answer
Step: 1 Unlock

Question Has Been Solved by an Expert!
Get step-by-step solutions from verified subject matter experts
Step: 2 Unlock
Step: 3 Unlock