

Question: Samuelson and Messenger (SAM) began 2021 with 200 units of its one product. These units were purchased near the end of 2020 for $25 each.
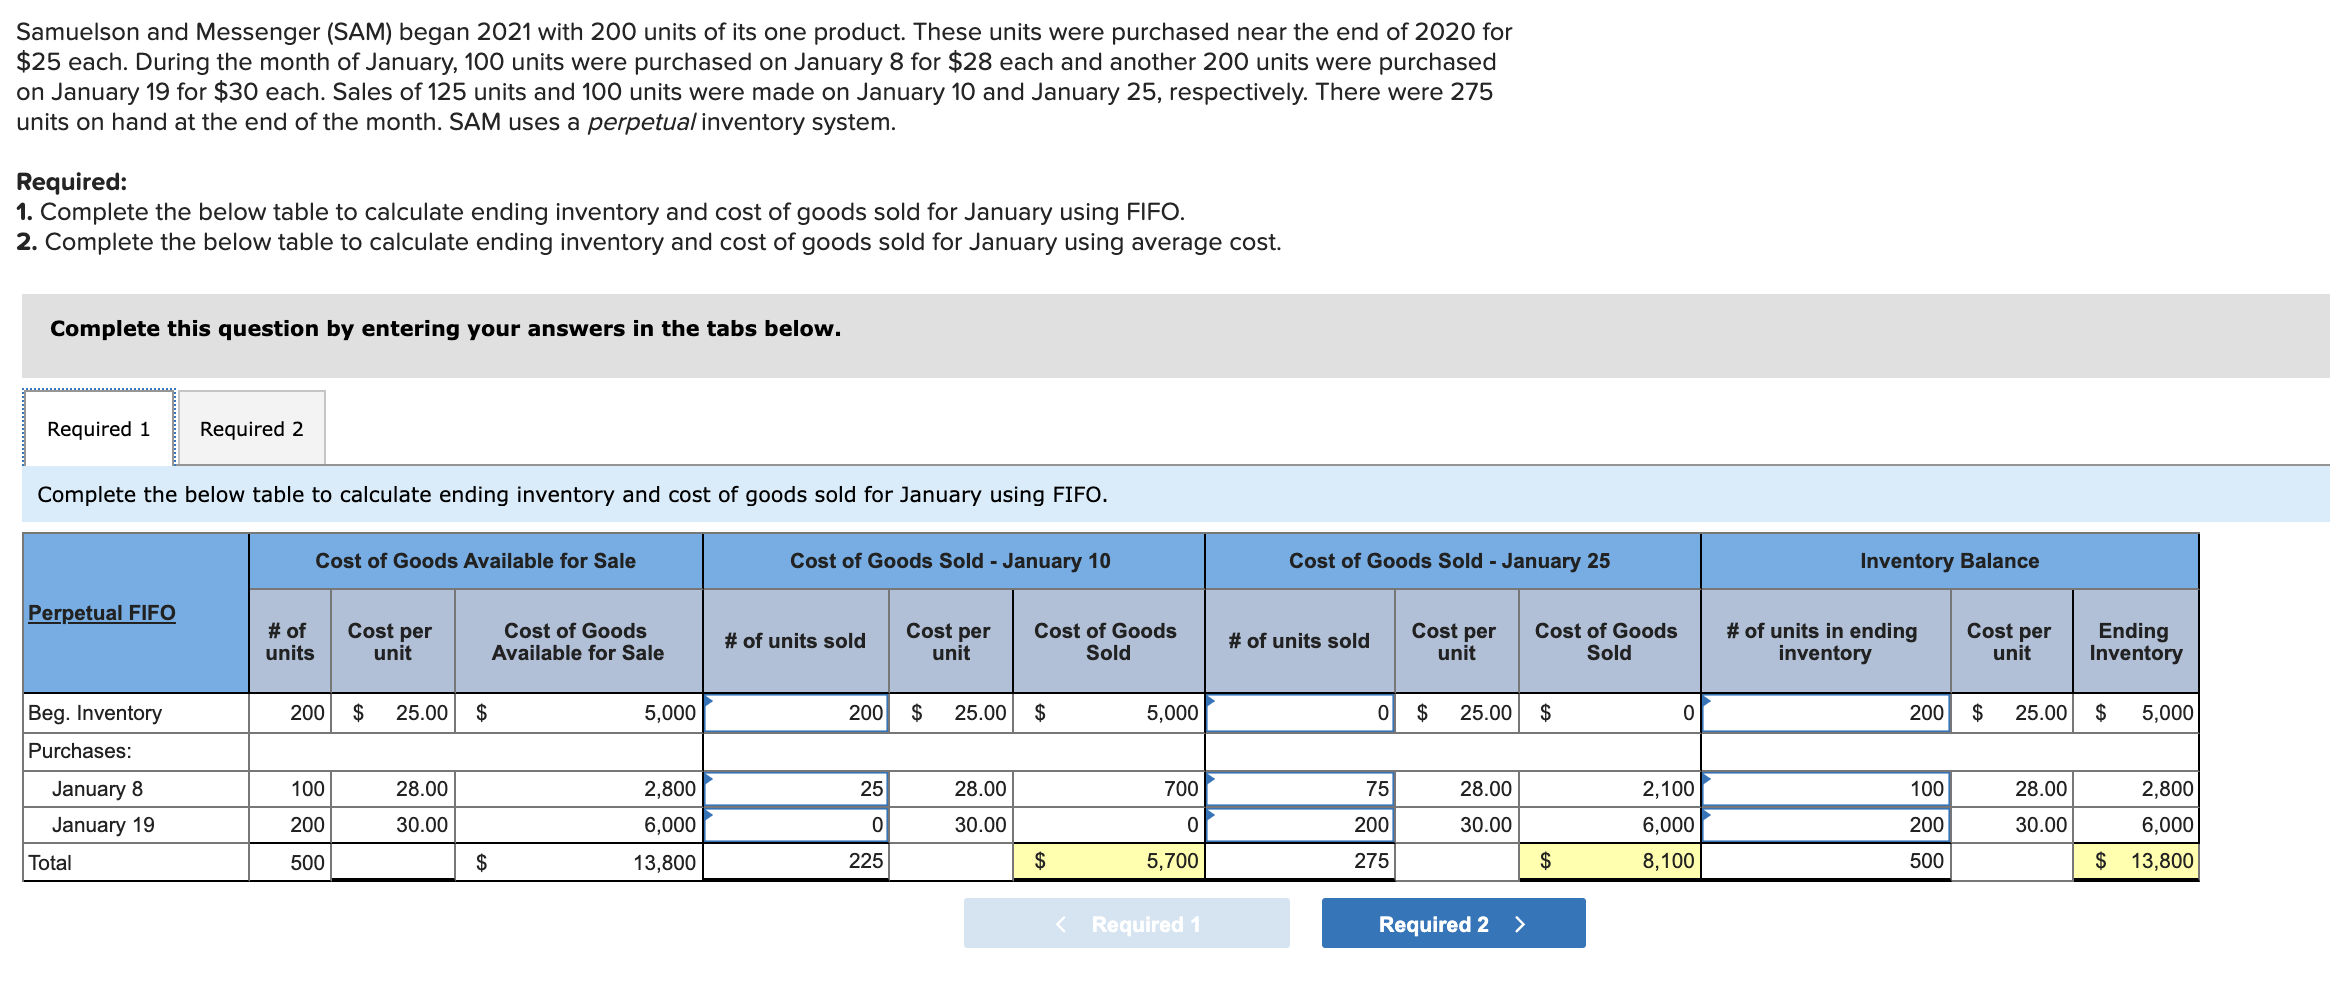
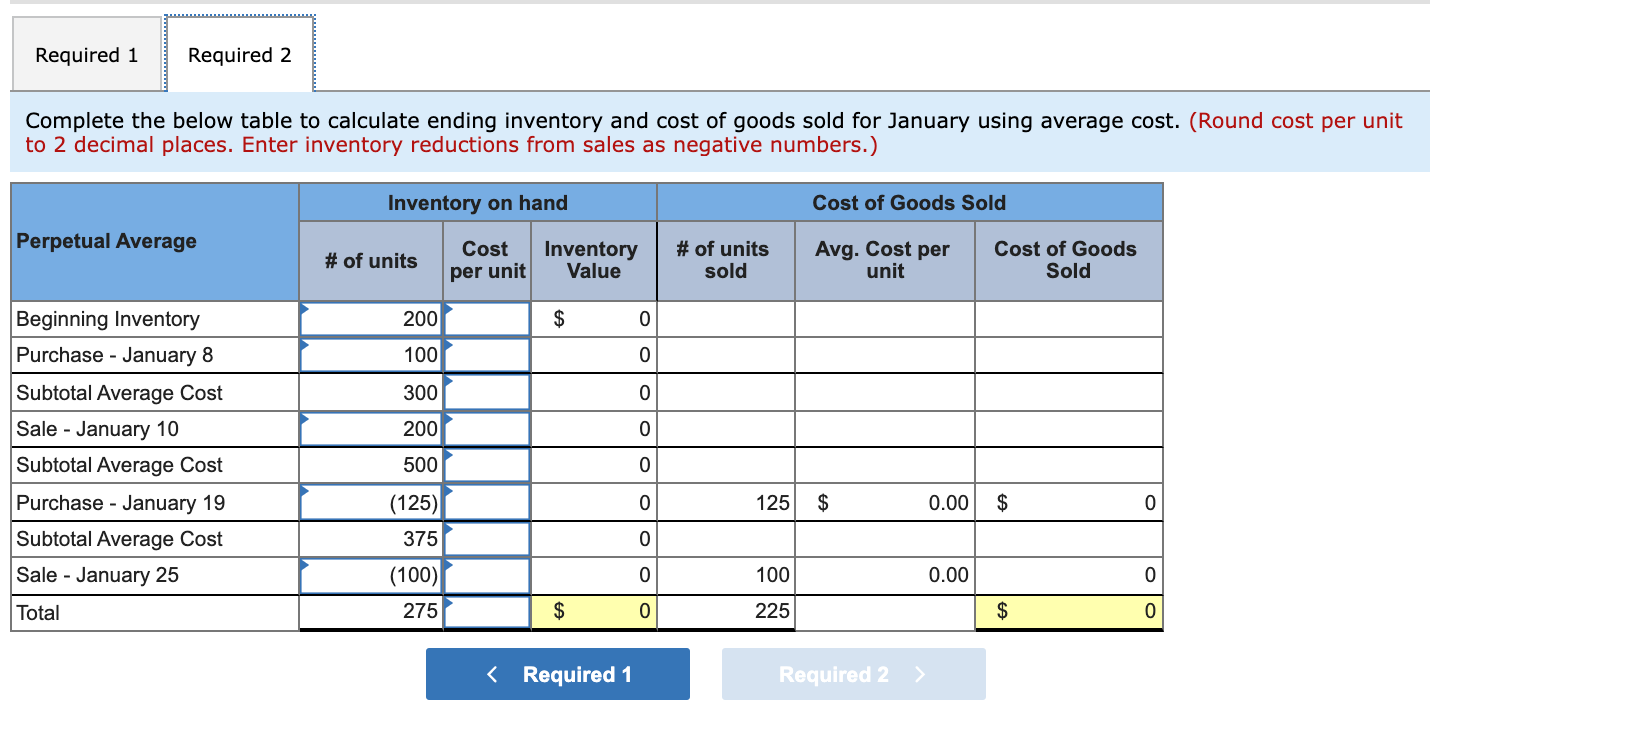
Samuelson and Messenger (SAM) began 2021 with 200 units of its one product. These units were purchased near the end of 2020 for $25 each. During the month of January, 100 units were purchased on January 8 for $28 each and another 200 units were purchased on January 19 for $30 each. Sales of 125 units and 100 units were made on January 10 and January 25, respectively. There were 275 units on hand at the end of the month. SAM uses a perpetual inventory system. Required: 1. Complete the below table to calculate ending inventory and cost of goods sold for January using FIFO. 2. Complete the below table to calculate ending inventory and cost of goods sold for January using average cost. Complete this question by entering your answers in the tabs below. Required 1 Required 2 Complete the below table to calculate ending inventory and cost of goods sold for January using FIFO. Cost of Goods Available for Sale Cost of Goods Sold - January 10 Cost of Goods Sold - January 25 Inventory Balance Perpetual FIFO Cost per # of units Cost of Goods Available for Sale # of units sold Cost per unit Cost of Goods Sold # of units sold Cost per unit Cost of Goods Sold # of units in ending inventory Cost per unit Ending Inventory unit Beg. Inventory 200 $ 25.00 $ 5,000 200 $ 25.00 $ 5,000 0 $ 25.00 $ 0 200 $ 25.00 $ 5,000 Purchases: 100 28.00 25 28.00 700 75 28.00 100 28.00 January 8 January 19 2,800 6,000 2,100 6,000 200 30.00 0 30.00 0 200 30.00 200 30.00 2,800 6,000 $ 13,800 Total 500 $ 13,800 225 $ 5,700 275 $ 8,100 500 Required 1 Required 2 Complete the below table to calculate ending inventory and cost of goods sold for January using average cost. (Round cost per unit to 2 decimal places. Enter inventory reductions from sales as negative numbers.) Inventory on hand Cost of Goods Sold Perpetual Average Cost # of units Inventory Value # of units sold Avg. Cost per unit Cost of Goods Sold per unit 200 $ 0 100 0 300 0 200 0 Beginning Inventory Purchase - January 8 Subtotal Average Cost Sale - January 10 Subtotal Average Cost Purchase - January 19 Subtotal Average Cost Sale - January 25 500 0 0 125 $ 0.00 $ 0 (125) 375 (100) Ooo 100 0.00 0 Total 275 $ 225 $ 0
Step by Step Solution
There are 3 Steps involved in it

Get step-by-step solutions from verified subject matter experts