

Question: SAS coding Use Proc Univariate to look at the distribution of insulin levels for white and black girls (all the subjects are girls in our
SAS coding
Use Proc Univariate to look at the distribution of insulin levels for white and black girls (all the subjects are girls in our dataset) at exam 10 in NGHSdata1.sas7bdat. Interpret the results.
a.?What are the average insulin levels for white and black girls?
b.?Use the information available from proc univariate (including doing a test of normality and interpreting the degree of skewness in the data) to determine whether these data are normally distributed.
c.?Generate box plots of insulin for white and black girls.
whats the code for this?
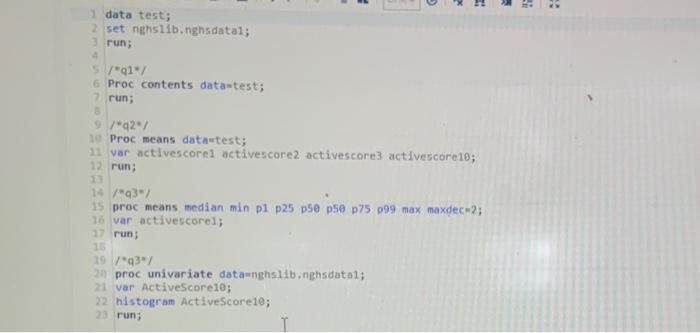
1 data test; 2 set nghslib.nghsdatal; 3 run; 4 5/*q1*/ 6 Proc contents data-test; 7 run; B 9/*92*/ 10 Proc means data-test; 11 var activescorel activescore2 activescore3 activescore10; 12 13 run; 14/"q3"/ 15 proc means median min p1 p25 p50 p50 p75 p99 max maxdec-2; 16 var activescorel; 17 run; 16 19/03/ 20 proc univariate data-nghslib.nghsdatal; 21 var ActiveScore10; 22 histogram ActiveScore10; 23 run; I
Step by Step Solution
There are 3 Steps involved in it
1 Expert Approved Answer
Step: 1 Unlock

Question Has Been Solved by an Expert!
Get step-by-step solutions from verified subject matter experts
Step: 2 Unlock
Step: 3 Unlock