

Question: SAS Program iv. vi. 1A. Write a SAS program to graph the following using the permanent data set HW1: i. The frequency of the regions.
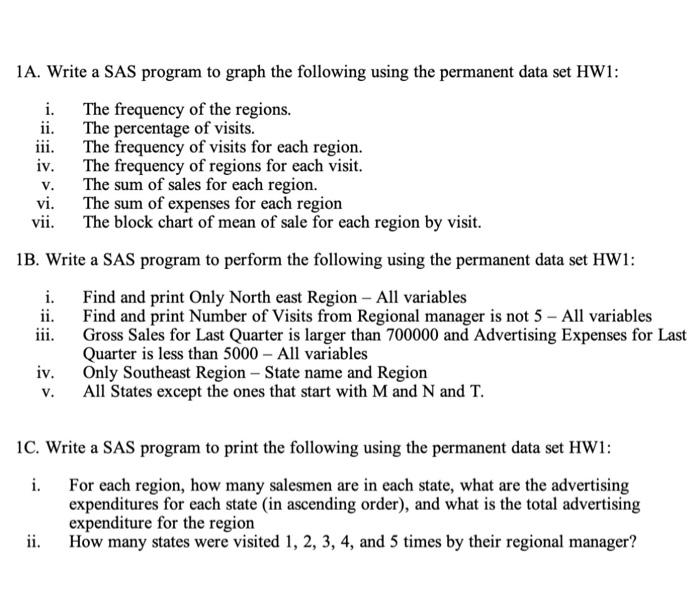
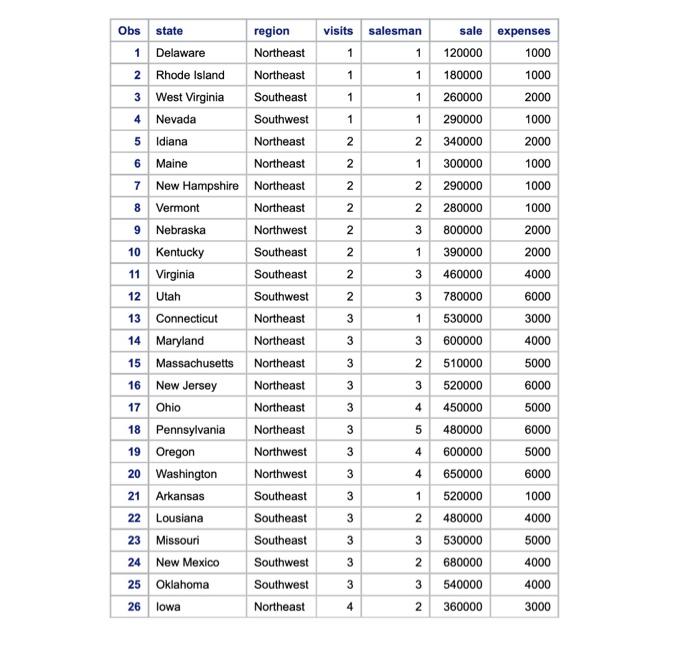
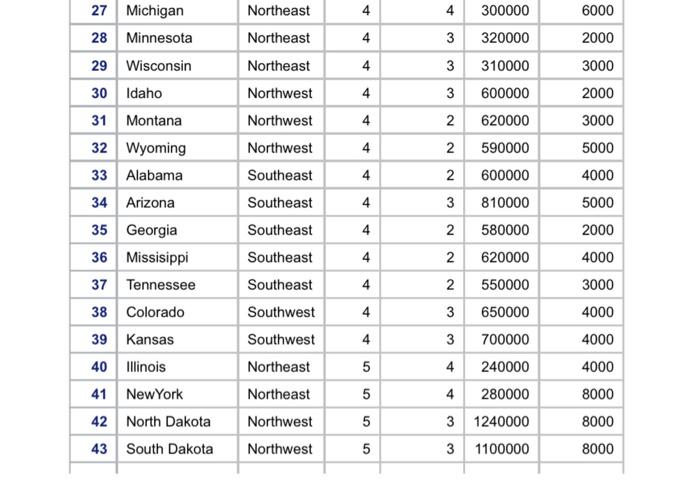
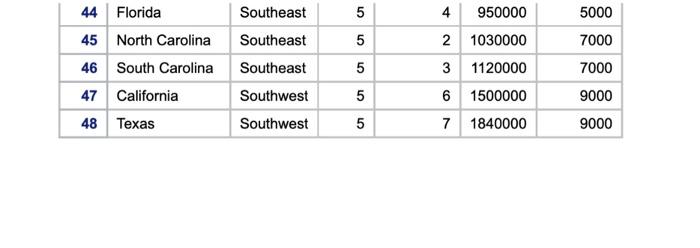
iv. vi. 1A. Write a SAS program to graph the following using the permanent data set HW1: i. The frequency of the regions. ii. The percentage of visits. iii. The frequency of visits for each region. The frequency of regions for each visit. V. The sum of sales for each region. The sum of expenses for each region vii. The block chart of mean of sale for each region by visit. 1B. Write a SAS program to perform the following using the permanent data set HWI: i. Find and print Only North east Region - All variables ii. Find and print Number of Visits from Regional manager is not 5 - All variables Gross Sales for Last Quarter is larger than 700000 and Advertising Expenses for Last Quarter is less than 5000 - All variables iv. Only Southeast Region - State name and Region v. All States except the ones that start with M and N and T. 1C. Write a SAS program to print the following using the permanent data set HW1: i. For each region, how many salesmen are in each state, what are the advertising expenditures for each state (in ascending order), and what is the total advertising expenditure for the region How many states were visited 1, 2, 3, 4, and 5 times by their regional manager? visits salesman 1 1 1 1 1 1 1 1 2 2 2 1 2 2 2 WN 2 2 1 2 3 2 3 Obs state region 1 Delaware Northeast 2 Rhode Island Northeast 3 West Virginia Southeast 4 Nevada Southwest 5 Idiana Northeast 6 Maine Northeast 7 New Hampshire Northeast 8 Vermont Northeast 9 Nebraska Northwest 10 Kentucky Southeast 11 Virginia Southeast 12 Utah Southwest 13 Connecticut Northeast 14 Maryland Northeast 15 Massachusetts Northeast 16 New Jersey Northeast 17 Ohio Northeast 18 Pennsylvania Northeast 19 Oregon Northwest 20 Washington Northwest 21 Arkansas Southeast 22 Lousiana Southeast 23 Missouri Southeast 24 New Mexico Southwest 25 Oklahoma Southwest 26 lowa Northeast 3 1 sale expenses 120000 1000 180000 1000 260000 2000 290000 1000 340000 2000 300000 1000 290000 1000 280000 1000 800000 2000 390000 2000 460000 4000 780000 6000 530000 3000 600000 4000 510000 5000 520000 6000 450000 5000 480000 6000 600000 5000 650000 6000 520000 1000 480000 4000 530000 5000 680000 4000 540000 4000 360000 3000 3 3 3 2 3 3 3 4 3 5 3 4 4 1 2 3 2 3 3 4 2 4 6000 2000 4 4 4 4 N 3000 2000 3000 5000 4000 4 300000 3 320000 3 310000 3 600000 620000 2 590000 2 600000 3 810000 2 580000 4 4 27 Michigan 28 Minnesota 29 Wisconsin 30 Idaho 31 Montana 32 Wyoming 33 Alabama 34 Arizona 35 Georgia 36 Missisippi 37 Tennessee 38 Colorado 39 Kansas 40 Illinois 41 New York 42 North Dakota 43 South Dakota 4 Northeast Northeast Northeast Northwest Northwest Northwest Southeast Southeast Southeast Southeast Southeast Southwest Southwest Northeast Northeast Northwest Northwest 5000 2000 4. N NNW 4 620000 4000 4 4 4 5 5 5 2 550000 3 650000 3 700000 4 240000 4 280000 3 1240000 3 1100000 3000 4000 4000 4000 8000 8000 8000 5 44 Florida 45 North Carolina 46 South Carolina 47 California 48 Texas Southeast Southeast Southeast Southwest Southwest 5 5 5 4 950000 2 1030000 3 1120000 6 1500000 7 1840000 5000 7000 7000 9000 9000 6 5
Step by Step Solution
There are 3 Steps involved in it

Get step-by-step solutions from verified subject matter experts