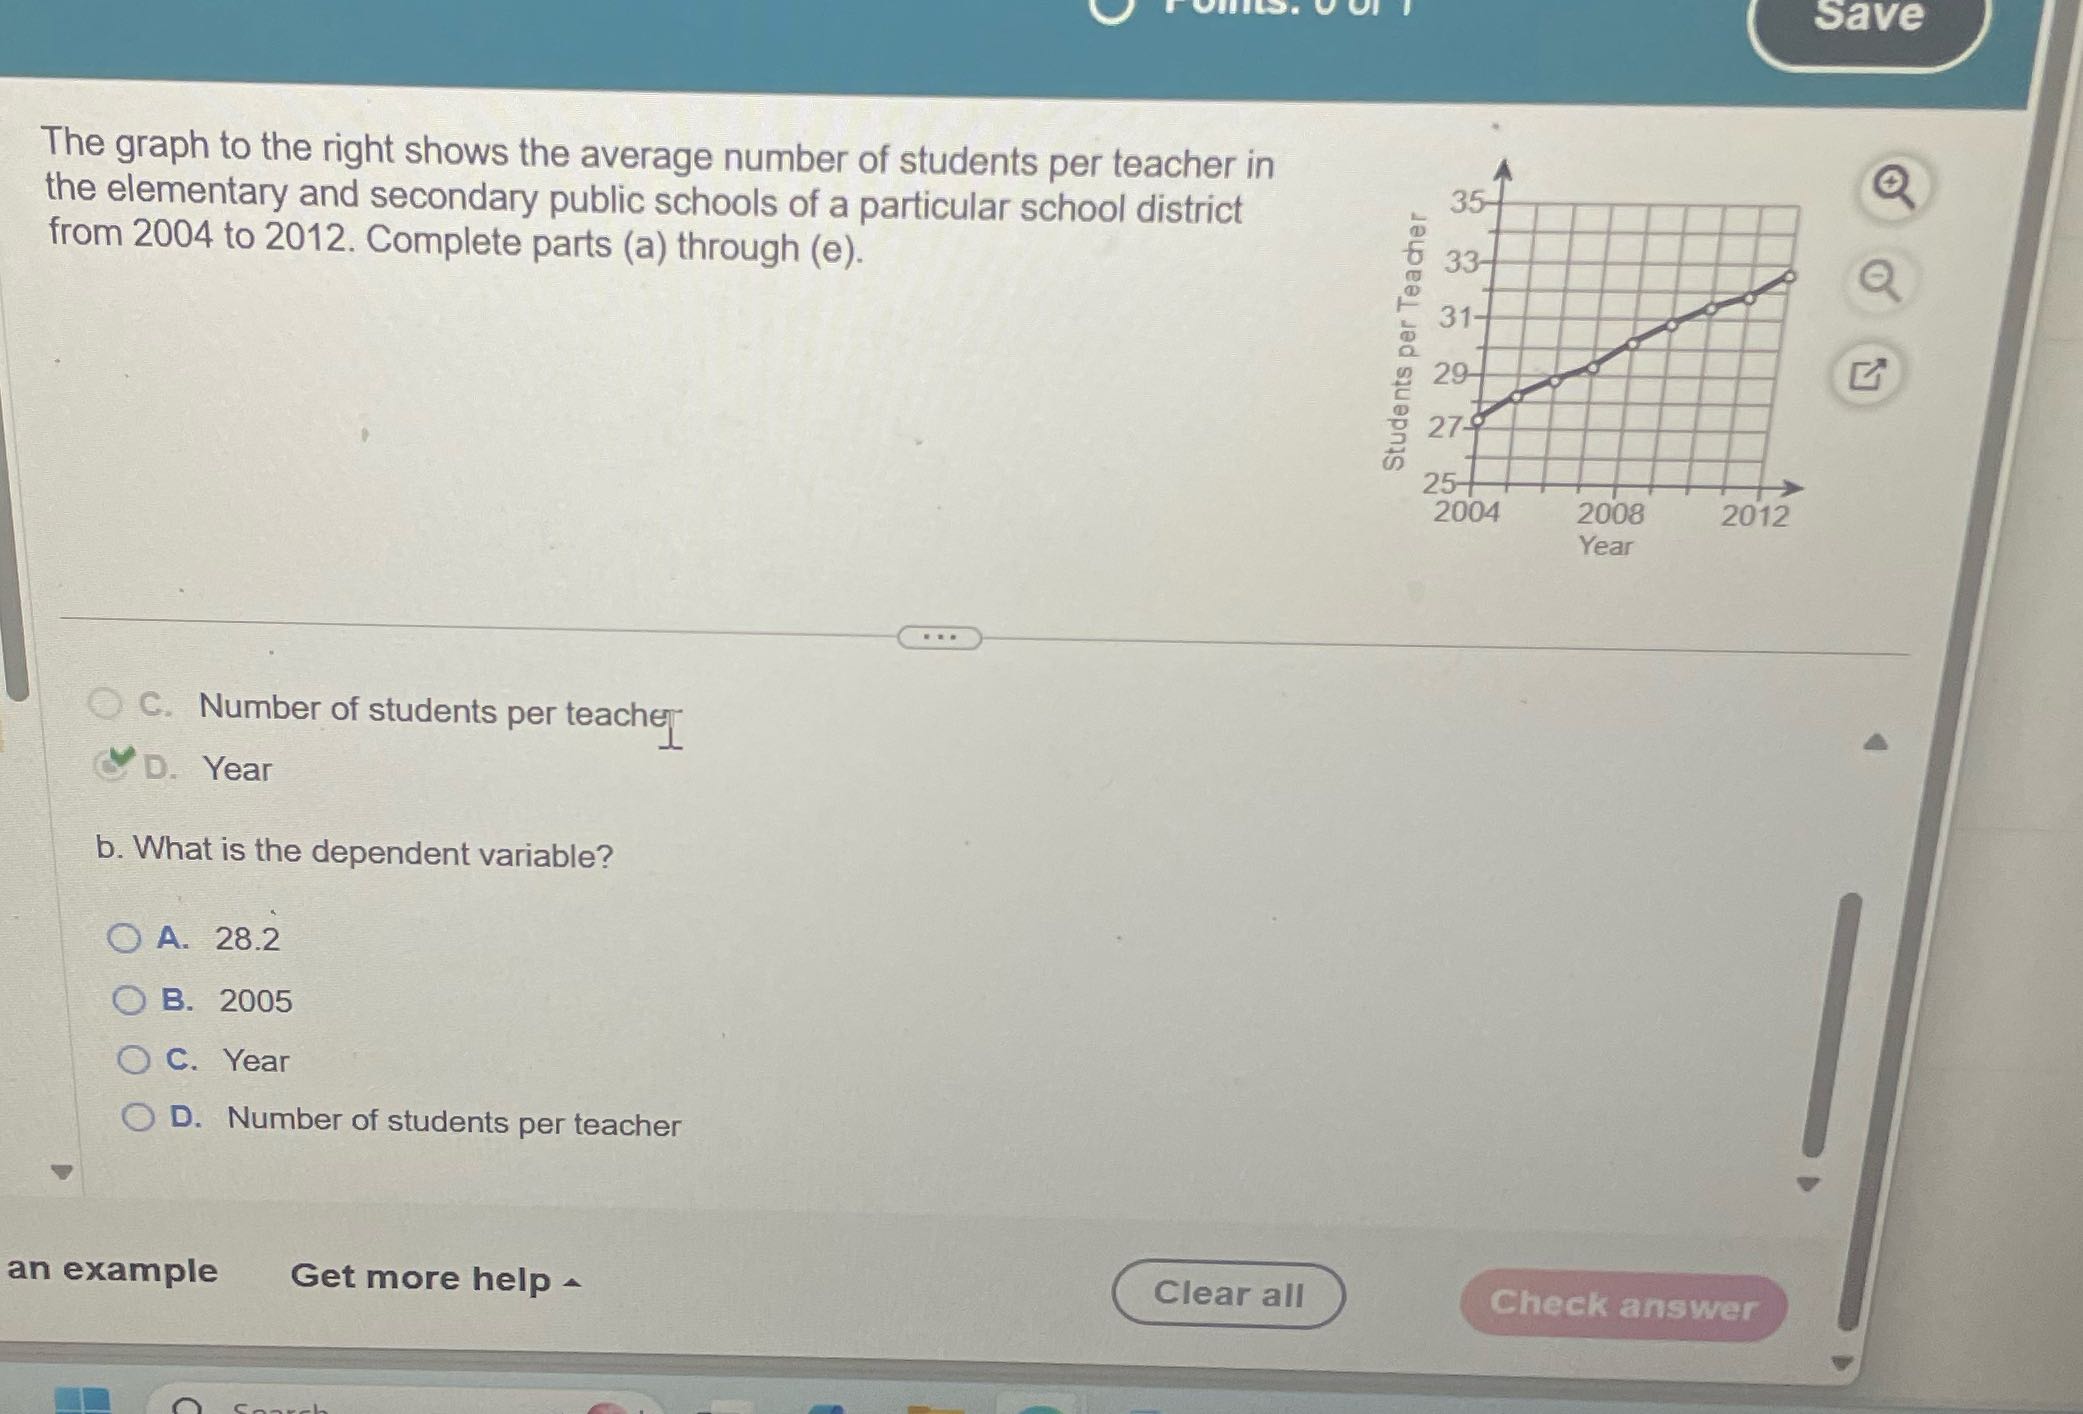
Question: Save The graph to the right shows the average number of students per teacher in the elementary and secondary public schools of a particular school

Save The graph to the right shows the average
Save The graph to the right shows the average number of students per teacher in the elementary and secondary public schools of a particular school district 35- from 2004 to 2012. Complete parts (a) through (e). Students per Teacher 25- 2004 2008 2012 Year O C. Number of students per teacher D. Year b. What is the dependent variable? O A. 28.2 O B. 2005 O C. Year O D. Number of students per teacher an example Get more help ~ Clear all Check

Step by Step Solution

There are 3 Steps involved in it

1 Expert Approved Answer
Step: 1 Unlock blur-text-image
Question Has Been Solved by an Expert!

Get step-by-step solutions from verified subject matter experts

Step: 2 Unlock
Step: 3 Unlock

Students Have Also Explored These Related Accounting Questions!