

Question: Saved Help Save & Exit Submit New - car sales of a dealer during the past year are shown in the following table, along with
Saved
Help
Save & Exit
Submit
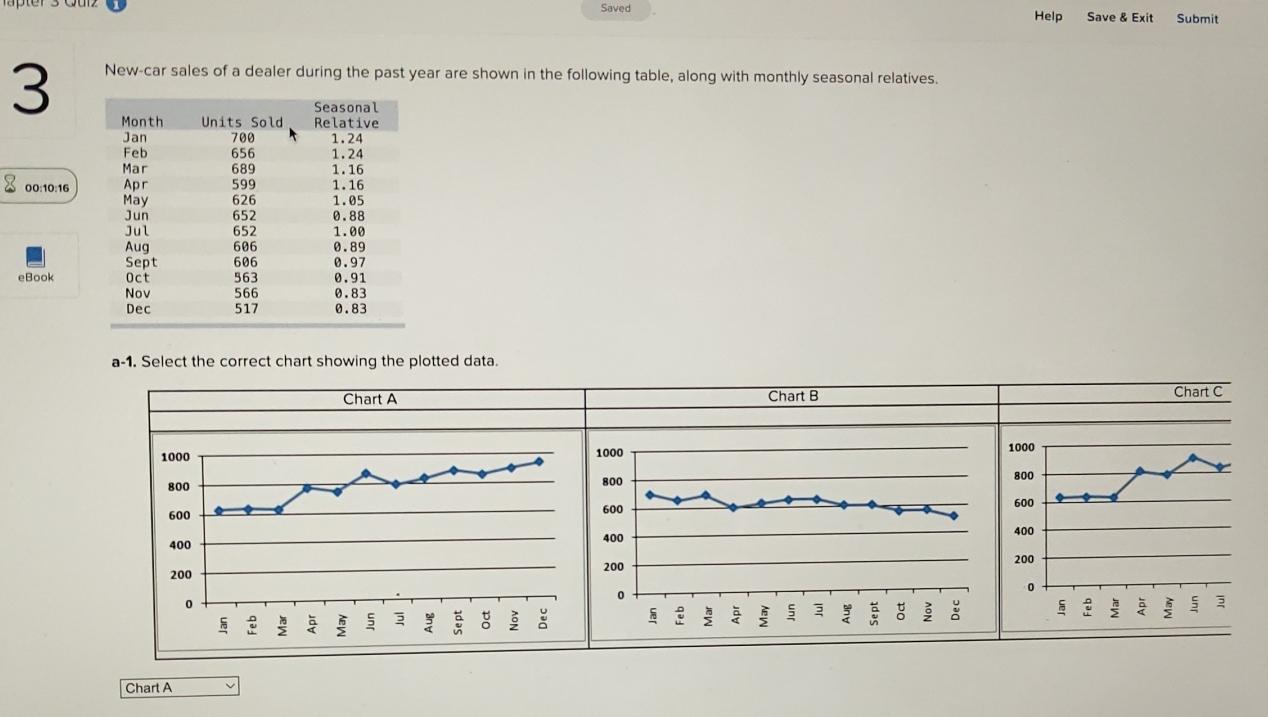
Newcar sales of a dealer during the past year are shown in the following table, along with monthly seasonal relatives.
tableMonthUnits Sold,tableSeasonalRelativeJanFebMarAprMayJunJulAugSeptOctNovDec
a Select the correct chart showing the plotted data.
Chart A
Step by Step Solution
There are 3 Steps involved in it
1 Expert Approved Answer
Step: 1 Unlock

Question Has Been Solved by an Expert!
Get step-by-step solutions from verified subject matter experts
Step: 2 Unlock
Step: 3 Unlock