

Question: Saved The following table shows cost data for a perfectly competitive firm. Output 1 2 3 4 Average Fixed Average Variable Average Total Marginal Cost
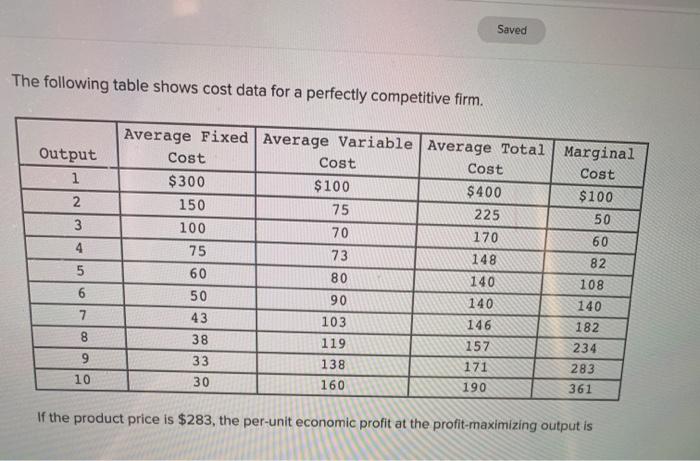
Saved The following table shows cost data for a perfectly competitive firm. Output 1 2 3 4 Average Fixed Average Variable Average Total Marginal Cost Cost Cost Cost $300 $100 $400 $100 150 75 225 50 100 70 170 60 75 73 148 82 60 80 140 108 50 90 140 140 43 103 146 182 38 119 157 234 33 138 171 283 30 160 190 361 5 6 7 8 9 10 If the product price is $283, the per-unit economic profit at the profit-maximizing output is Saved The following table shows cost data for a perfectly competitive firm. Output 1 2 3 4 Average Fixed Average Variable Average Total Marginal Cost Cost Cost Cost $300 $100 $400 $100 150 75 225 50 100 70 170 60 75 73 148 82 60 80 140 108 50 90 140 140 43 103 146 182 38 119 157 234 33 138 171 283 30 160 190 361 5 6 7 8 9 10 If the product price is $283, the per-unit economic profit at the profit-maximizing output is
Step by Step Solution
There are 3 Steps involved in it

Get step-by-step solutions from verified subject matter experts