

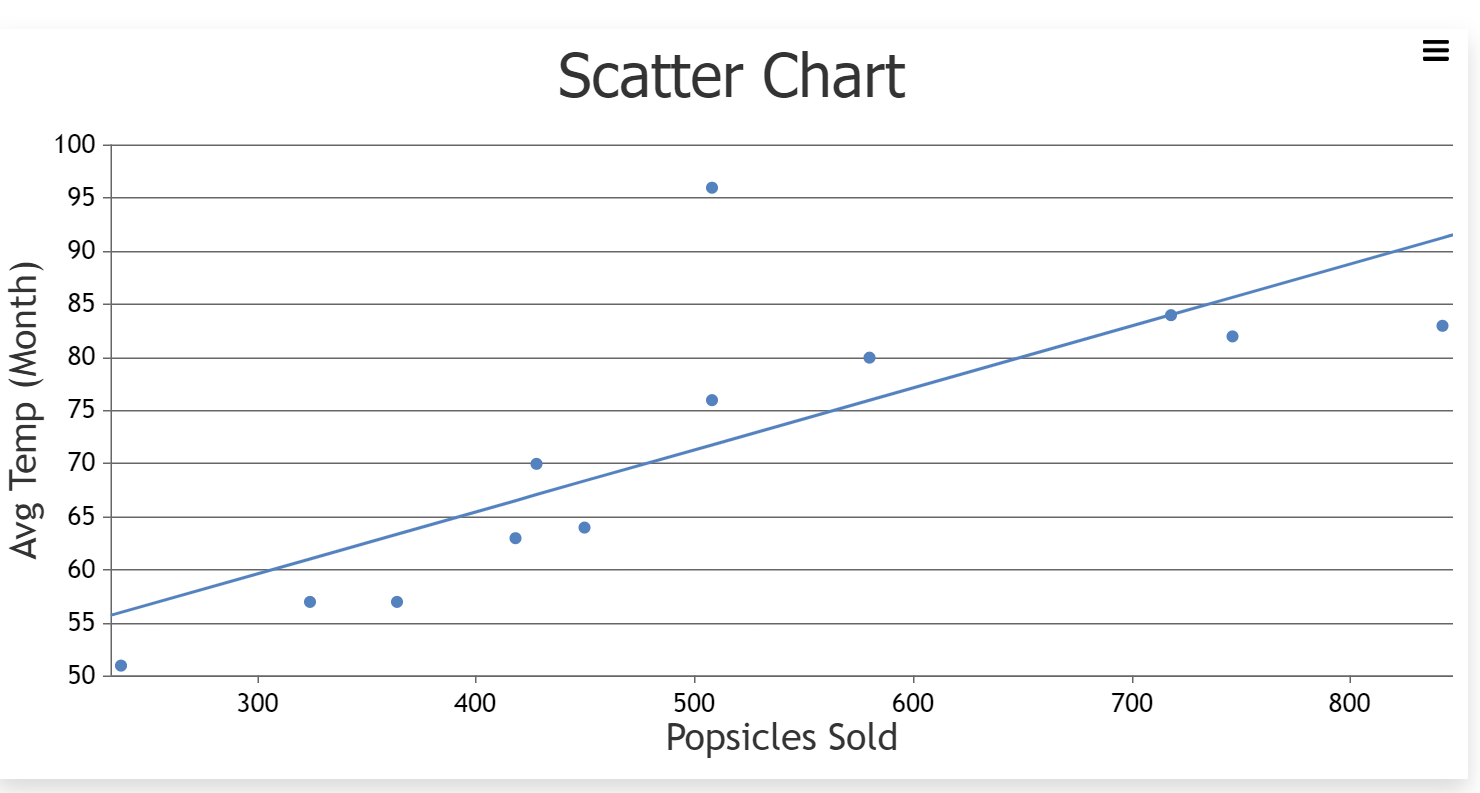
Question: Scatter Chart E 100 95 90 85 80 Avg Temp (Month) 75 70 65 60 55 50 300 400 500 600 700 800 Popsicles Sold
Step by Step Solution
There are 3 Steps involved in it
1 Expert Approved Answer
Step: 1 Unlock

Question Has Been Solved by an Expert!
Get step-by-step solutions from verified subject matter experts
Step: 2 Unlock
Step: 3 Unlock