

Question: Scatter Plot A Scatter Plot B Scatter Plot C Floor Space and Weekly Sales Floor Space and Weekly Sales Floor Space and Weekly Sales 20,000
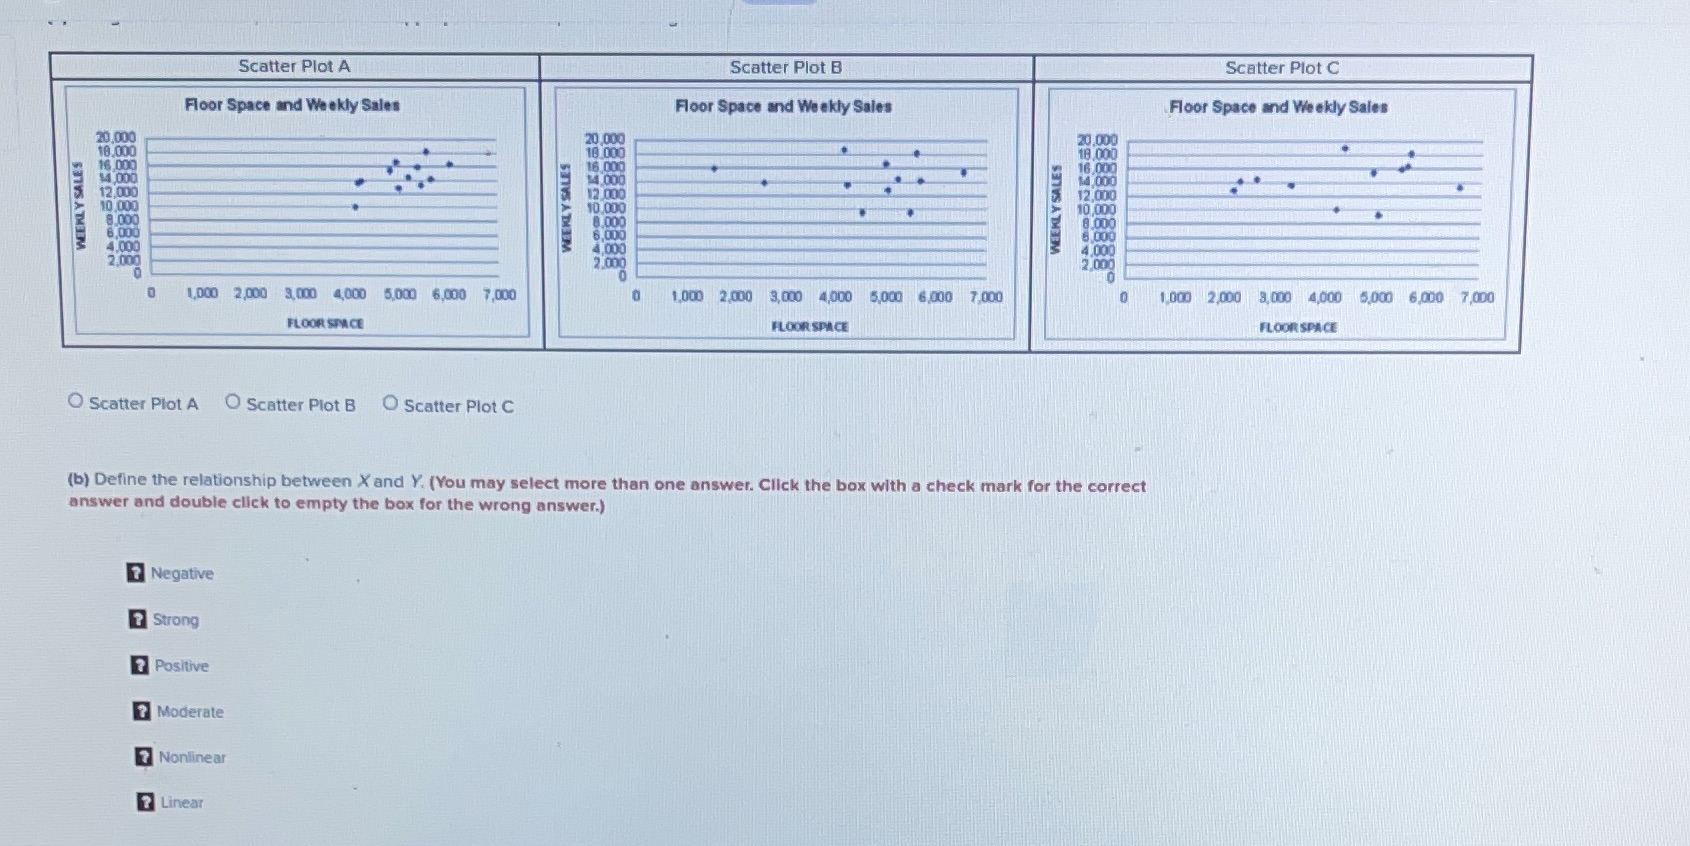
Scatter Plot A Scatter Plot B Scatter Plot C Floor Space and Weekly Sales Floor Space and Weekly Sales Floor Space and Weekly Sales 20,000 20,000 20,000 18,000 18/000 18,000 16,000 16 000 16 000 14,000 14 000 14 000 12,000 12 000 12.000 WEEKLY SALES 10,000 10 000 10,000 8.000 8.000 8.000 6,000 6,000 6.000 4,000 4,000 4,000 2.000 2 000 2 000 TO 0 1,DO0 2,000 3,000 4,000 5,000 6,000 7,000 1,000 2,000 3,000 4,000 5,000 6,000 7,000 1,000 2,000 8,000 4,000 5,000 6,000 7,000 FLOOR SPACE FLOOR SPACE FLOOR SPACE O Scatter Plot A O Scatter Plot B O Scatter Plot C (b) Define the relationship between X and Y. (You may select more than one answer. Click the box with a check mark for the correct answer and double click to empty the box for the wrong answer.) 7 Negative ? Strong 7 Positive 7 Moderate 7 Nonlinear ? Linear
Step by Step Solution
There are 3 Steps involved in it

Get step-by-step solutions from verified subject matter experts