

Question: Scatter Plot ( I dont help creating the graph I just need help picking which measures should be used for the column and rows )
Scatter Plot I dont help creating the graph I just need help picking which measures should be used for the column and rows
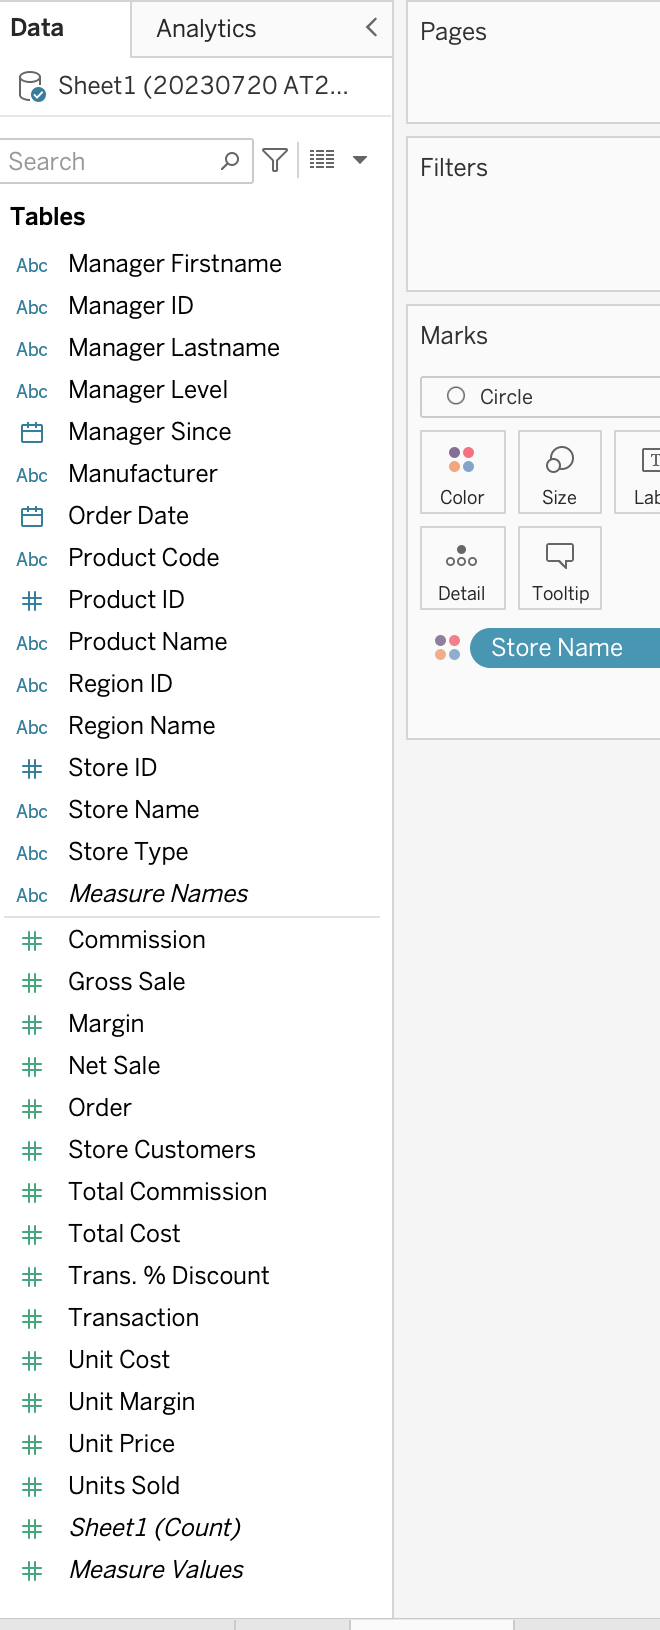
Create a scatterplot showing the variation of the transactions' average discount due to the total number of transactions for each store, ie each dot represents a store. You want to see if stores with more transactions offer a larger average discount.
Add a linear trend line.
Identify labels and units for the x and y axes appropriately, eg use whole numbers with reasonable decimal places.
Step by Step Solution
There are 3 Steps involved in it
1 Expert Approved Answer
Step: 1 Unlock

Question Has Been Solved by an Expert!
Get step-by-step solutions from verified subject matter experts
Step: 2 Unlock
Step: 3 Unlock