

Question: Scenario 1 Initial Temperature Distribution Scenario 3 Initial Temperature Distribution Scenario 2 Initial Temperature Distribution Scenario 4 Initial Temperature Distribution Each graph shows the initial
Scenario Initial Temperature Distribution
Scenario Initial Temperature Distribution
Scenario Initial Temperature Distribution
Scenario Initial Temperature Distribution
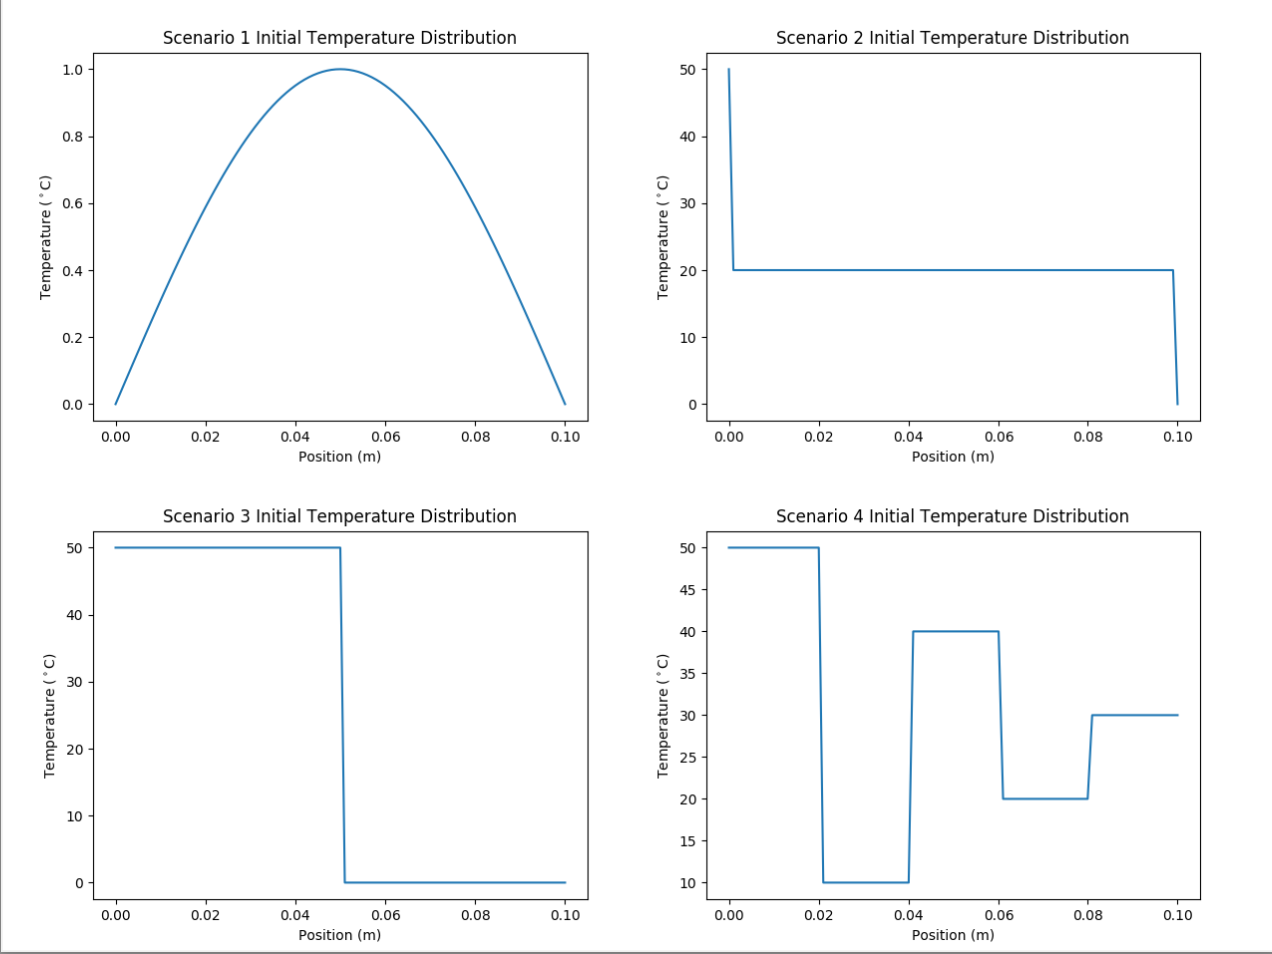
Each graph shows the initial time temperature distribution for a metal rod which is insulated along its length and has its ends fixed at the temperatures shown. The system is allowed to come to equilibrium and will be modeled using python. Draw in different colors and label the expected temperature distribution output of the simulation a shortly after the simulation begins timecong s and b after a very long time and the system has reached steadystate timeinfty
After the metal rod in scenario reaches steadystate, predict the temperature in the middle of the rod. After the metal rod in scenario reaches steadystate, predict the temperature in the middle of the rod. After the metal rod in scenario reaches steadystate, predict the temperature in the middle of the rod. After the metal rod in scenario reaches steadystate, predict the temperature in the middle of the rod.
Step by Step Solution
There are 3 Steps involved in it
1 Expert Approved Answer
Step: 1 Unlock

Question Has Been Solved by an Expert!
Get step-by-step solutions from verified subject matter experts
Step: 2 Unlock
Step: 3 Unlock