

Question: Scenario 2 Use the scenario described below to answer the following questions. A researcher new to the Tucson area was shocked when she received her
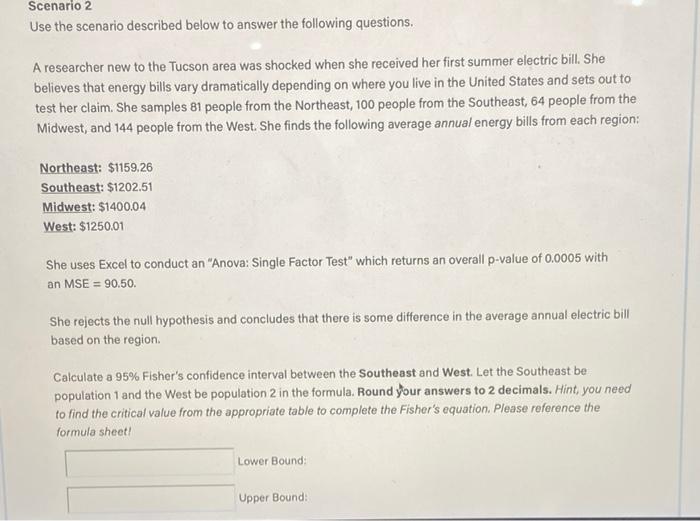
Scenario 2 Use the scenario described below to answer the following questions. A researcher new to the Tucson area was shocked when she received her first summer electric bill. She believes that energy bills vary dramatically depending on where you live in the United States and sets out to test her claim. She samples 81 people from the Northeast, 100 people from the Southeast, 64 people from the Midwest, and 144 people from the West. She finds the following average annual energy bills from each region: Northeast: $1159.26 Southeast: $1202.51 Midwest: $1400.04 West: $1250.01 She uses Excel to conduct an "Anova: Single Factor Test" which returns an overall p-value of 0.0005 with an MSE = 90.50 She rejects the null hypothesis and concludes that there is some difference in the average annual electric bill based on the region. Calculate a 95% Fisher's confidence interval between the Southeast and West. Let the Southeast be population 1 and the West be population 2 in the formula. Round your answers to 2 decimals. Hint, you need to find the critical value from the appropriate table to complete the Fisher's equation. Please reference the formula sheet! Lower Bound: Upper Bound
Step by Step Solution
There are 3 Steps involved in it

Get step-by-step solutions from verified subject matter experts