

Question: A manufacturer is using statistical process control analysis on a new machine model to determine if that model should be purchased. Questions 32 to
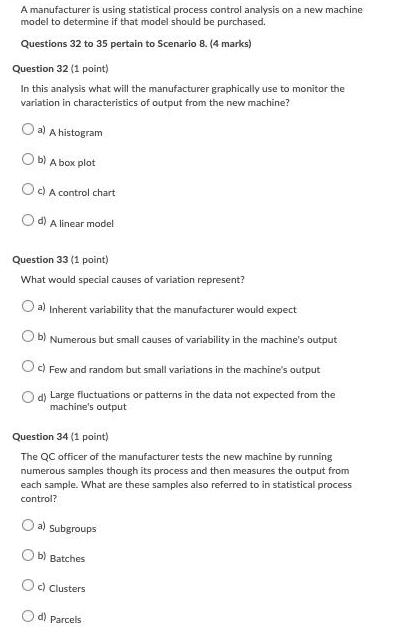
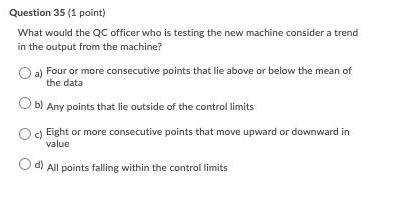
A manufacturer is using statistical process control analysis on a new machine model to determine if that model should be purchased. Questions 32 to 35 pertain to Scenario 8. (4 marks) Question 32 (1 point) In this analysis what will the manufacturer graphically use to monitor the variation in characteristics of output from the new machine? O a) A hstogram O b) A box plot Oc) A control chart d) A linear model Question 33 (1 point) What would special causes of variation represent? a) Inherent variability that the manufacturer would expect O b) Numerous but small causes of variability in the machine's output Oc) Few and random but small variations in the machine's output O d) Large fluctuations or patterns in the data not expected from the machine's output Question 34 (1 point) The QC officer of the manufacturer tests the new machine by running numerous samples though its process and then measures the output from each sample. What are these samples also referred to in statistical process control? O a) Subgroups O b) Batches O) Clusters d) Parceis Question 35 (1 point) What would the QC officer who is testing the new machine consider a trend in the output from the machine? a) Four or more consecutive points that lie above or below the mean of the data b) Any points that lie outside of the control limits Eight or more consecutive points that move upward or downward in value d) All points falling within the control limits
Step by Step Solution
3.50 Rating (167 Votes )
There are 3 Steps involved in it
32 C Control chart Control charts also known as Shewhart charts or processbehaviour charts are a type of statistical process control chart used to det... View full answer

Get step-by-step solutions from verified subject matter experts