

Question: Scenario Type of Statistical Test to use Hypotheses (write the null and alternative hypotheses symbolically) Test Statistic Formula (Write the formula: do not perform calculations)
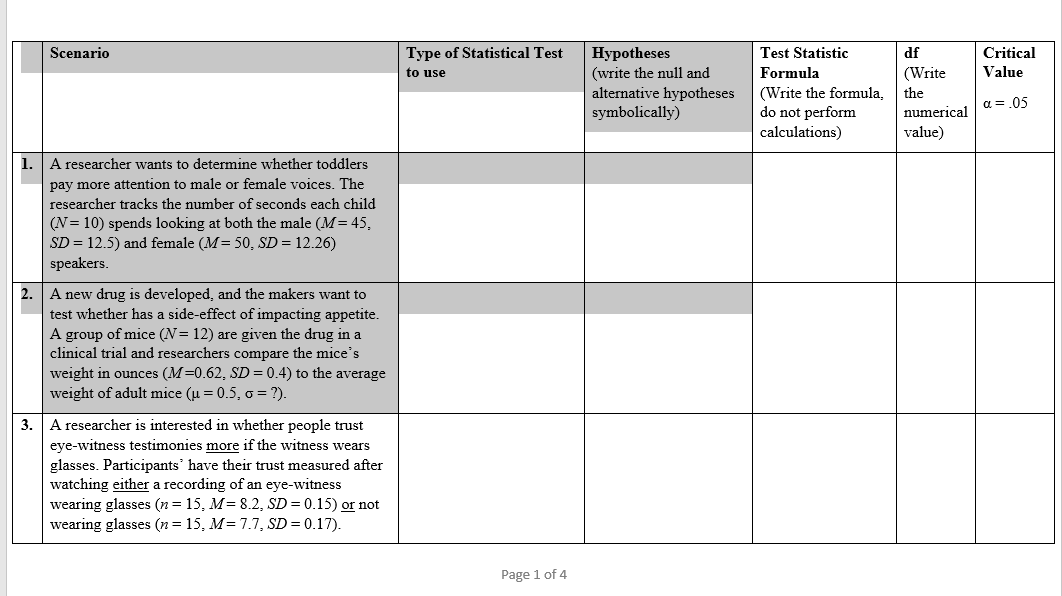
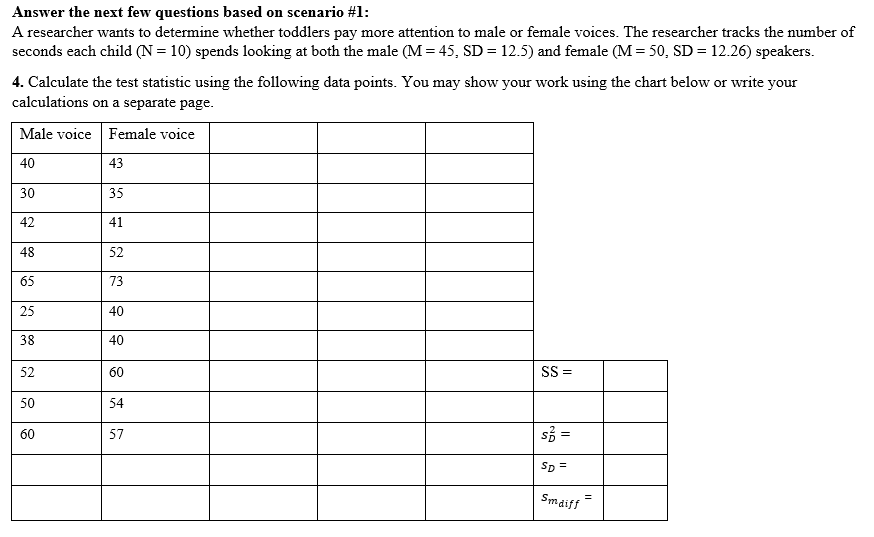
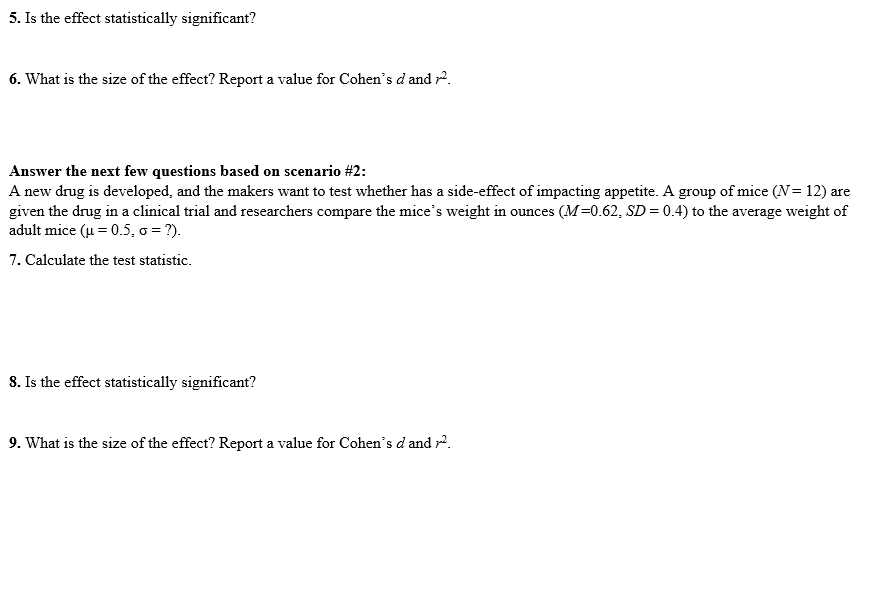
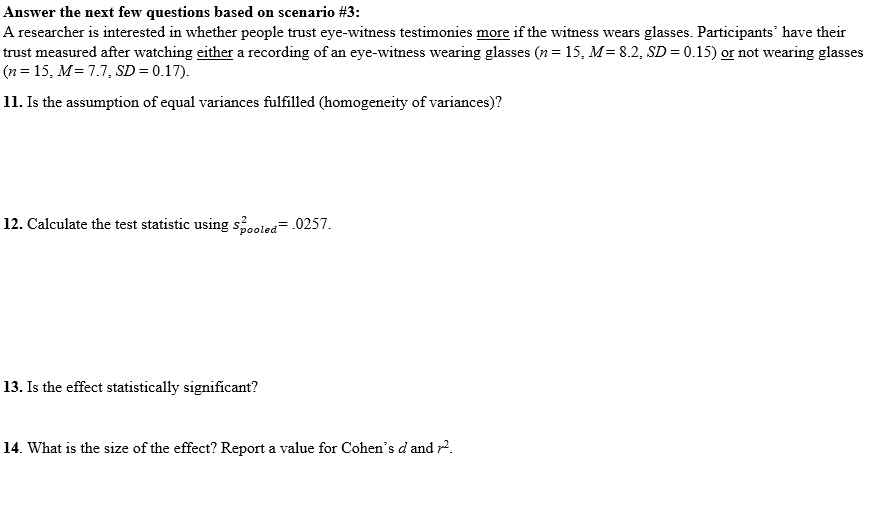
Scenario Type of Statistical Test to use Hypotheses (write the null and alternative hypotheses symbolically) Test Statistic Formula (Write the formula: do not perform calculations) df (Write the numerical value) Critical Yalu e c1=.05 A researcher wants to determine whether toddlers pay more attention to male or female voices. The researcher tracks the number of seconds each child (N: 10) spends looking at both the male (M: 45. SD = 12.5) and female (1 = 50, SD =12_26) speakers. Anew drug is developed, and the makers want to test whether has a sideeffect of impacting appetite. A group ofmice (N: 12) are given the drug in a clinical trial and researchers compare the mice's weight in ounces (31:062.: SD = 0.4) to the average weight ofadult mice ([1. = 0.5, o = 1'). A researcher is interested in. whether people trust eye-witness testimonies more if the witness wears glasses. Participants" have their trust measured aer watching either a recording of an eye-witness wearing glasses (a: =15..-'i:f= 8.2.51) = 0.15) g not wearing glasses (at = 15:51: T_T_ SD = 0.17). Answer the next few questions based on scenario #1: A researcher 1wants to determine whether toddlers pay more attention to male or female voices. The researcher tracks the number of seconds each child (N = 10] spends looking at both the male (M = 4i SD = 12.5) and female (M = '30: SD = 12.26) speakers. 4. Calculate the test statistic using the following data points. You ma}r show your work using the chart below or write your calculations on a separate page. 5. Is the effect statistically significant? 6. What is the size of the effect? Report a value for Cohen's d and p. Answer the next few questions based on scenario #2: A new drug is developed, and the makers want to test whether has a side-effect of impacting appetite. A group of mice (N = 12) are given the drug in a clinical trial and researchers compare the mice's weight in ounces (M=0.62, SD = 0.4) to the average weight of adult mice (u = 0.5, 6 = ?). 7. Calculate the test statistic. 8. Is the effect statistically significant? 9. What is the size of the effect? Report a value for Cohen's d and p.Answer the next few questions based on scenario #3: A researcher is interested in whether people trust eye-witness testimonies more if the witness wears glasses. Participants' have their trust measured after watching either a recording of an eye-witness wearing glasses (n = 15, M= 8.2, SD =0.15) or not wearing glasses (n = 15, M= 7.7, SD = 0.17). 11. Is the assumption of equal variances fulfilled (homogeneity of variances)? 12. Calculate the test statistic using s? Spooled= . 0257. 13. Is the effect statistically significant? 14. What is the size of the effect? Report a value for Cohen's d and 2
Step by Step Solution
There are 3 Steps involved in it

Get step-by-step solutions from verified subject matter experts