

Question: School Satisfaction Su nrey Student 1 Stud ent 2 Student 15 Student 3 Student 4 Student 5 Student 6 Student Tr' Student 8 Student 9
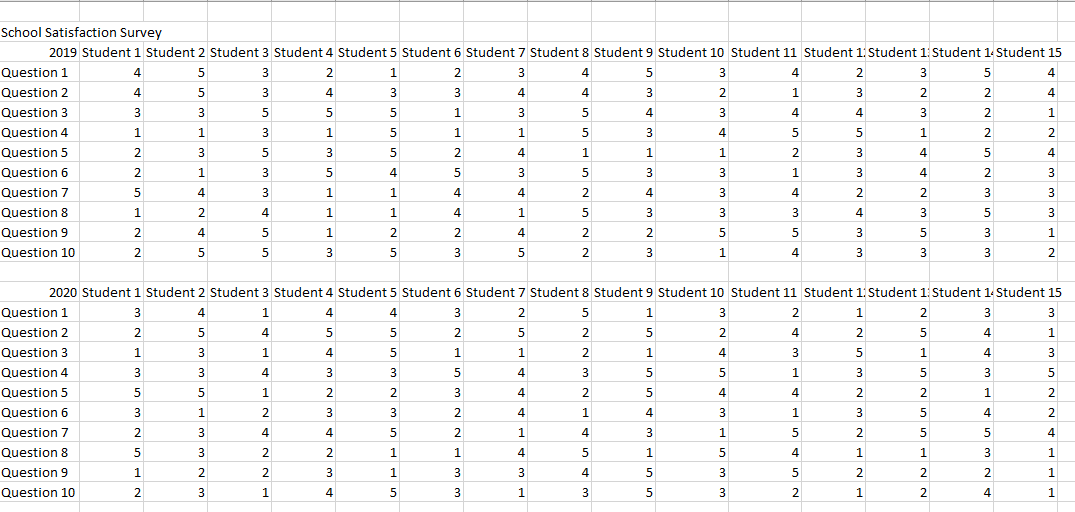
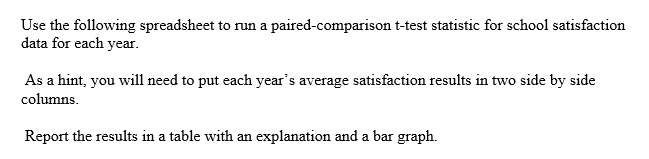
School Satisfaction Su nrey Student 1 Stud ent 2 Student 15 Student 3 Student 4 Student 5 Student 6 Student Tr' Student 8 Student 9 Student 10 Student 11 Student Student 1 Question 1 5 4 Questionz 4 2 4 Question 3 3 3 5 5 5 1 3 5 4 3 4 4 3 2 1 Question 4 1 1 3 1 5 1 1 5 3 4 5 5 1 2 2 Question 5 2 3 5 3 5 2 4 1 1 1 2 3 4 5 4 Question 6 2 1 3 5 4 5 3 5 3 3 1 3 4 2 3 Question '1' 5 4 3 1 1 4 4 2 4 3 4 2 2 3 3 Question 8 1 2 4 1 1 4 1 5 3 3 3 4 3 5 3 Question 9 2 4 5 1 2 2 4 2 2 5 5 3 5 3 1 Question 10 2 5 5 3 5 3 5 2 3 1 4 3 3 3 2 2020 Student 1 Student 2 Student 3 Student 4 Student 5 Student 6 Student Tr' Student 8 Student 9 Student 10 Student 11 Student JJStud ent 1 Student 1- Student 15 Question 1 3 4 1 4 4 3 2 5 1 3 2 1 2 3 3 Question 2 2 5 4 5 5 2 5 2 5 2 4 2 5 4 1 Question 3 1 3 1 4 5 1 1 2 1 4 3 5 1 4 3 Question 4 3 3 4 3 3 5 4 3 5 5 1 3 5 3 5 Question 5 5 5 1 2 2 3 4 2 5 4 4 2 2 1 2 Question 6 3 1 2 3 3 2 4 1 4 3 1 3 5 4 2 Question 3' 2 3 4 4 5 2 1 4 3 1 5 2 5 5 4 Question 8 5 3 2 2 1 1 4 5 1 5 4 1 1 3 1 Question 9 1 2 2 3 1 3 3 4 5 3 5 2 2 2 1 Question 10 2 3 1 4 5 3 1 3 5 3 2 1 2 4 1 Use the following spreadsheet to run a paired-comparison t-test statistic for school satisfaction data for each year. As a hint, you will need to put each year's average satisfaction results in two side by side columns. Report the results in a table with an explanation and a bar graph
Step by Step Solution
There are 3 Steps involved in it

Get step-by-step solutions from verified subject matter experts