

Question: Science Construct a line chart for the data. 29) 29) Student Test Scores Score Frequency 10-14 15-19 2 5 20-24 13 25-29 17 30-34 6
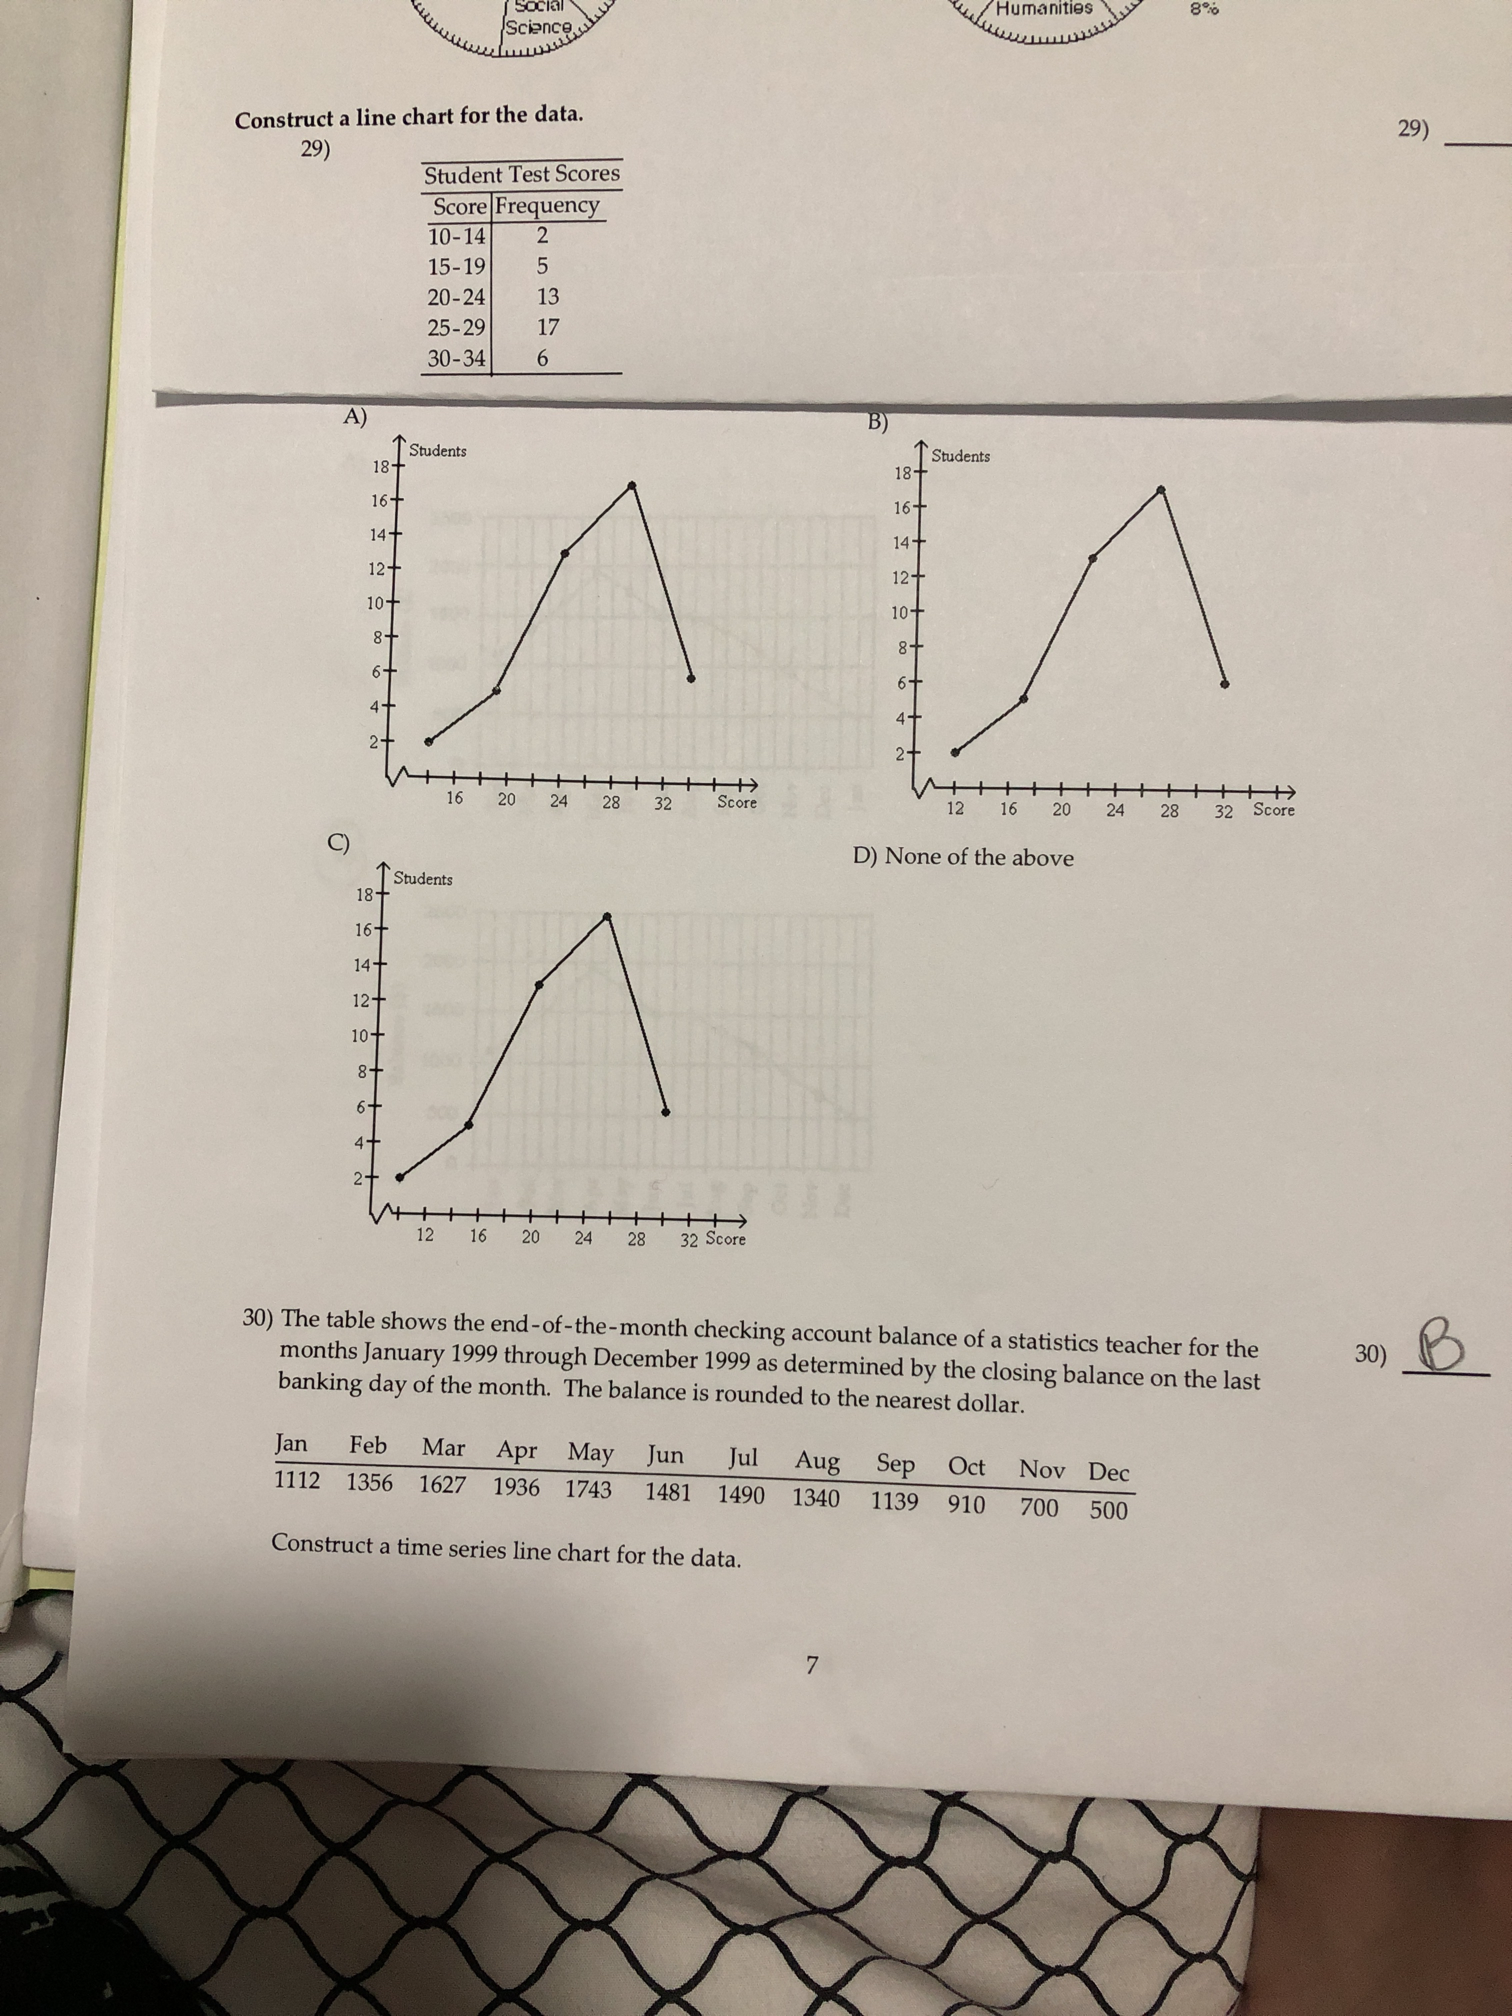
Science Construct a line chart for the data. 29) 29) Student Test Scores Score Frequency 10-14 15-19 2 5 20-24 13 25-29 17 30-34 6 A) B) I Students 18 T Students 16+ 18 16+ 12+ 14 + 10 + 12 + 10+ N 16 20 24 28 32 Score 20 24 28 32 Score C ) Students D) None of the above 18 16+ 14 + 12 + 20 24 28 32 Score 30) The table shows the end-of-the-month checking account balance of a statistics teacher for the months January 1999 through December 1999 as determined by the closing balance on the last 30) banking day of the month. The balance is rounded to the nearest dollar. B Jan Feb Mar Apr May Jun Jul Aug Sep Oct Nov Dec 112 1356 1627 1936 1743 1481 1490 1340 1139 910 700 500 Construct a time series line chart for the data. 7
Step by Step Solution
There are 3 Steps involved in it

Get step-by-step solutions from verified subject matter experts