

Question: science | IT... DG Object Oriented Pr... 1G My orders Metal Gear Solid 1.,, Apporto | App and... .Oop assignment | 1... Calorie Calculator -..
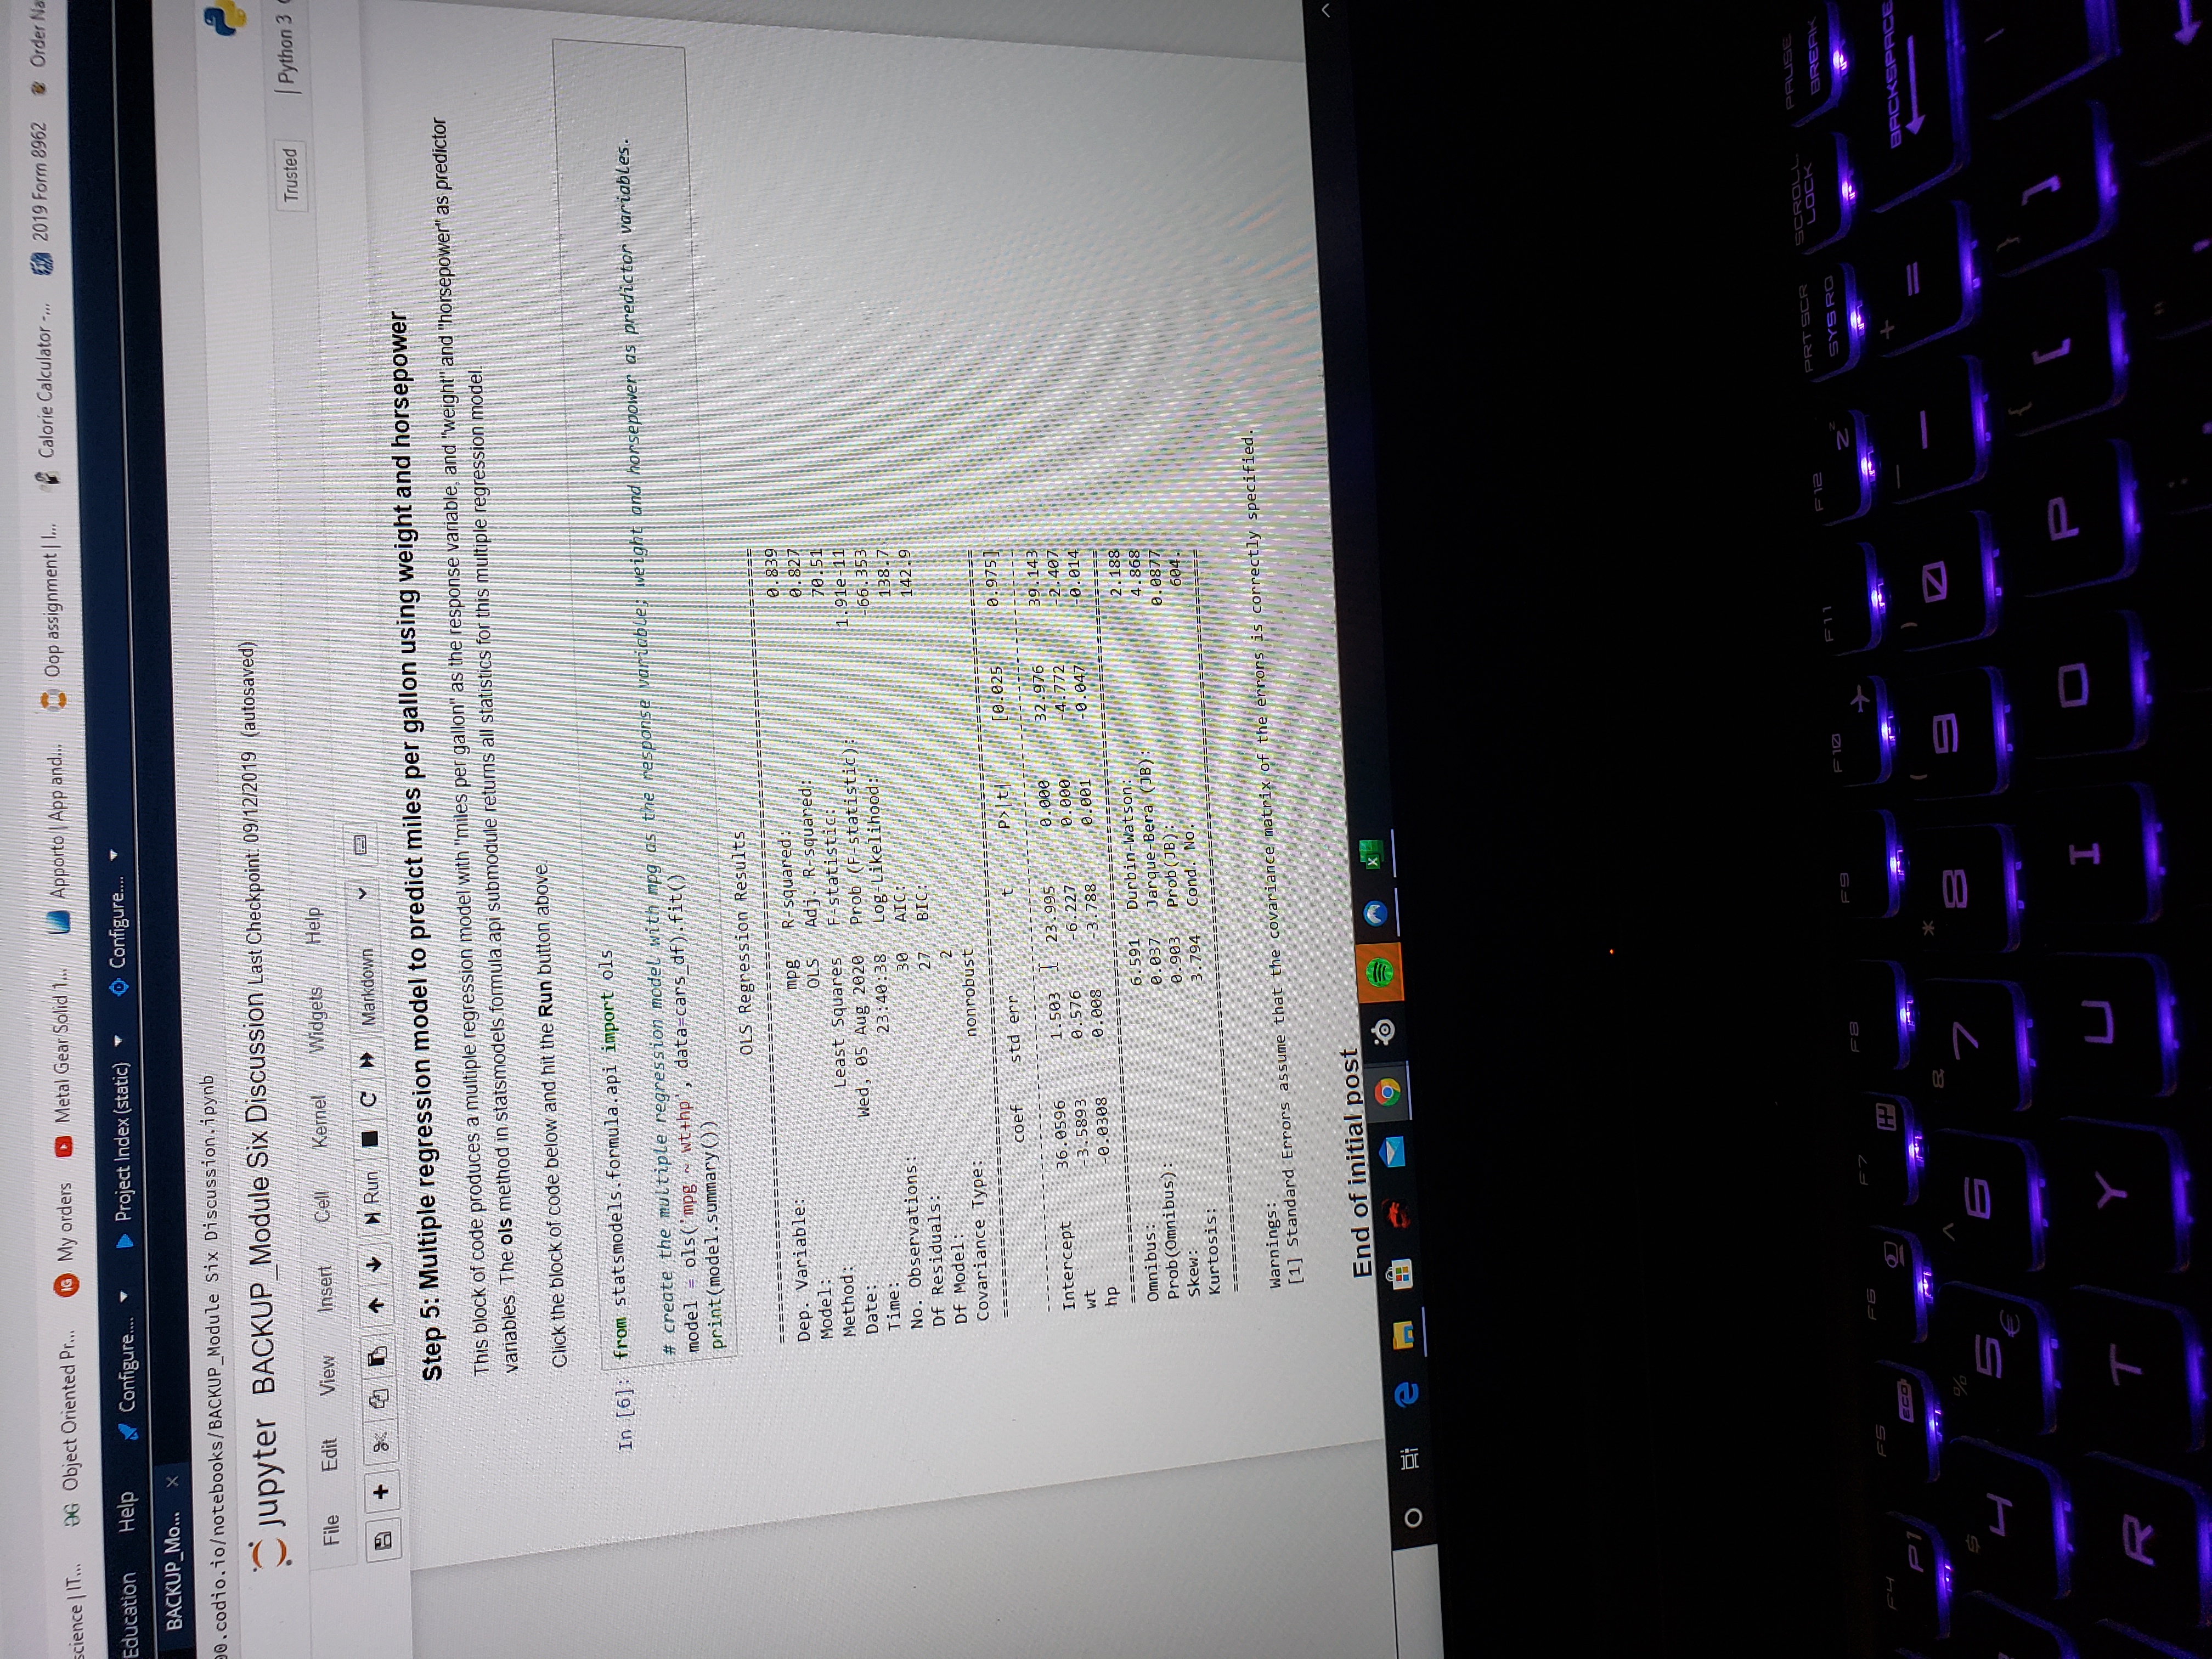
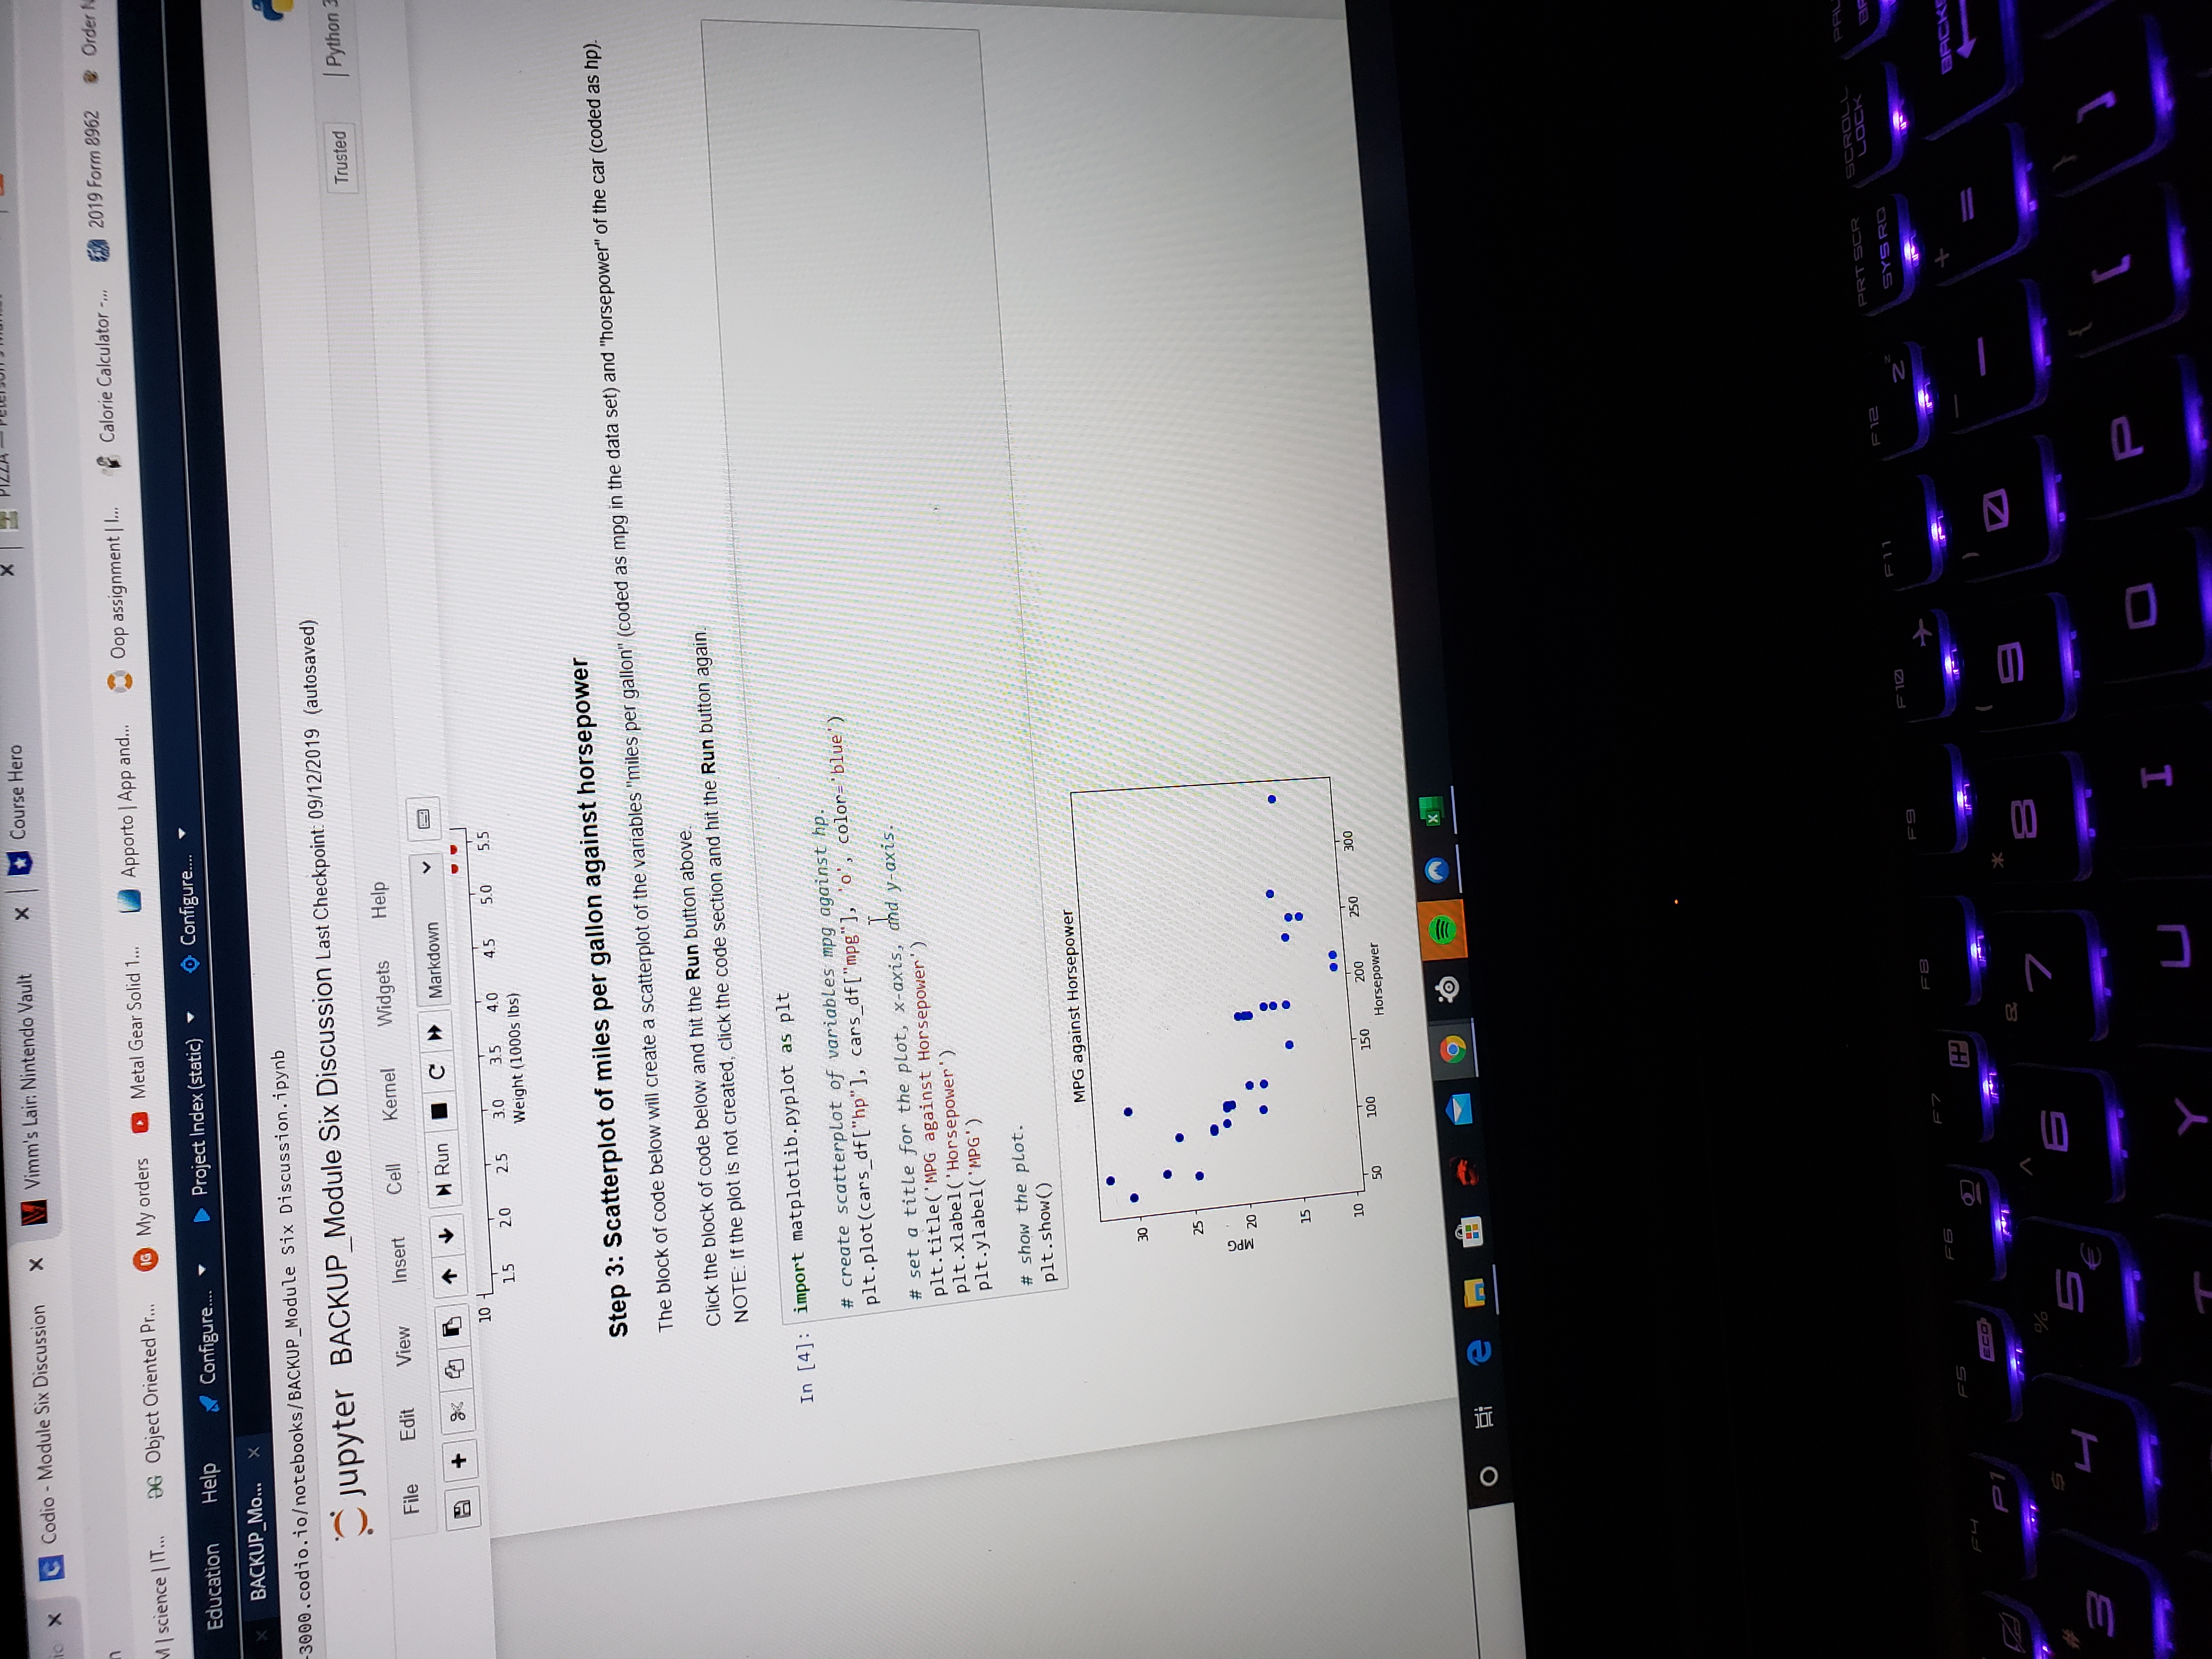
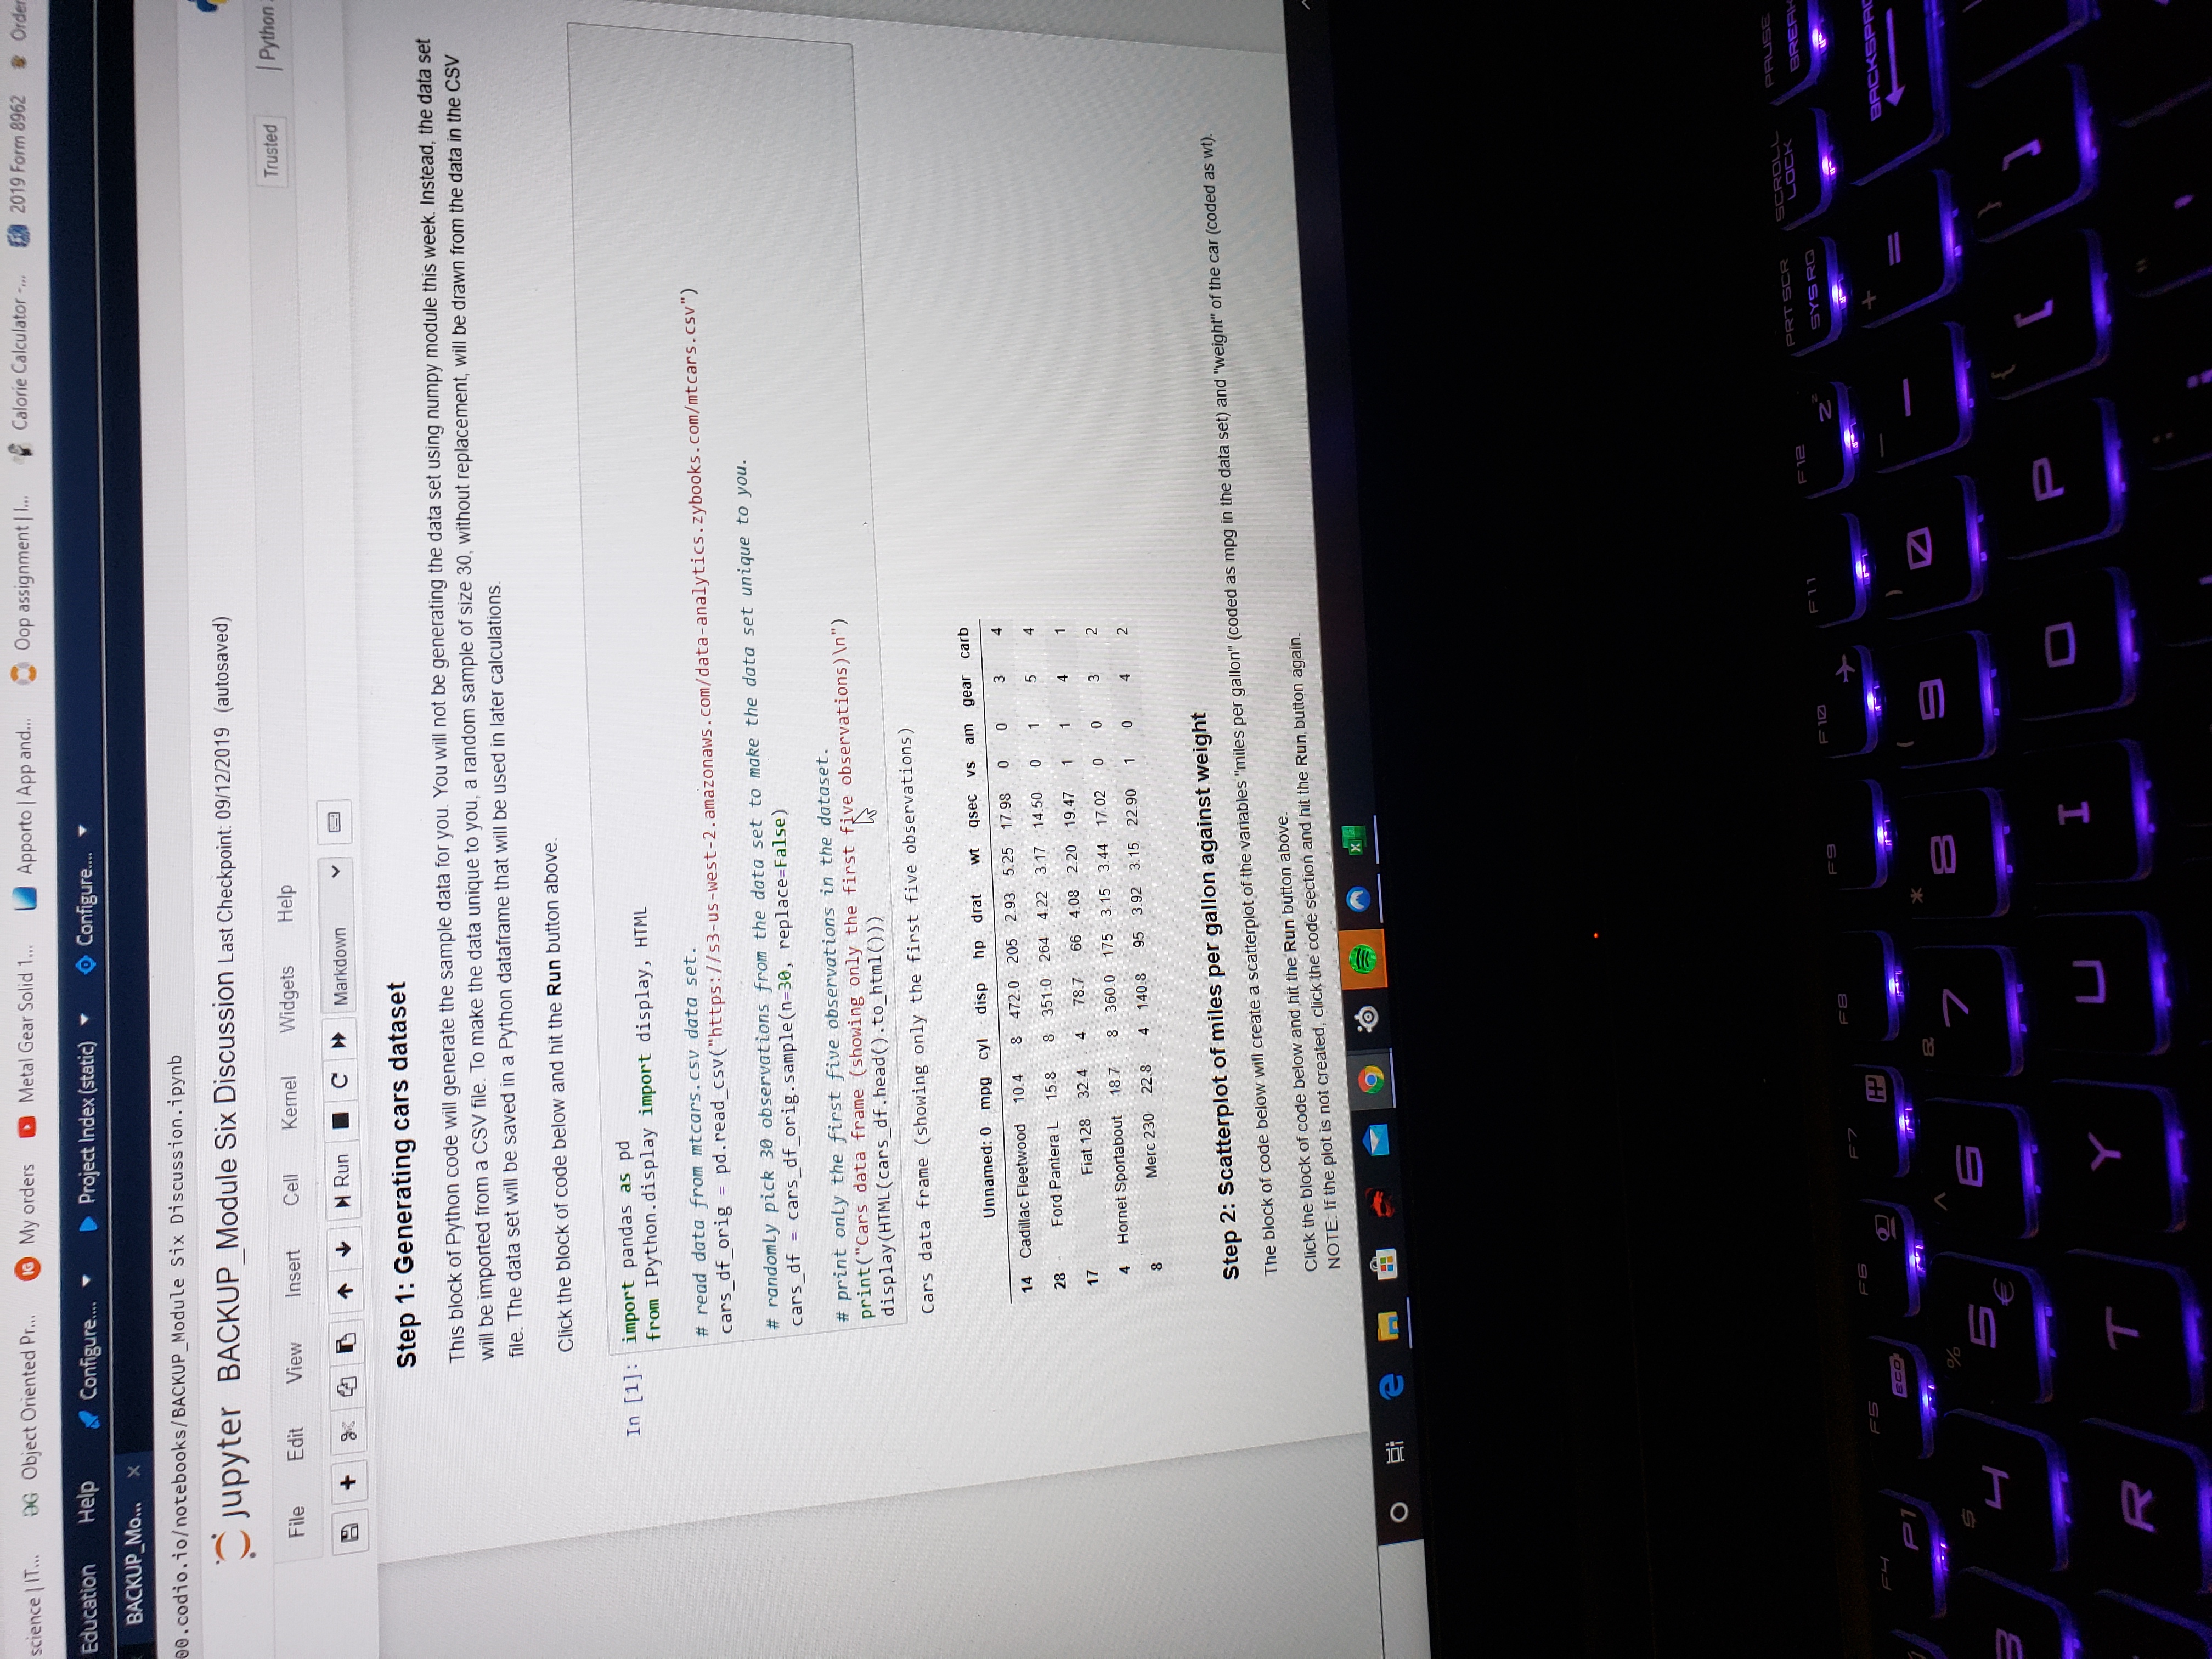
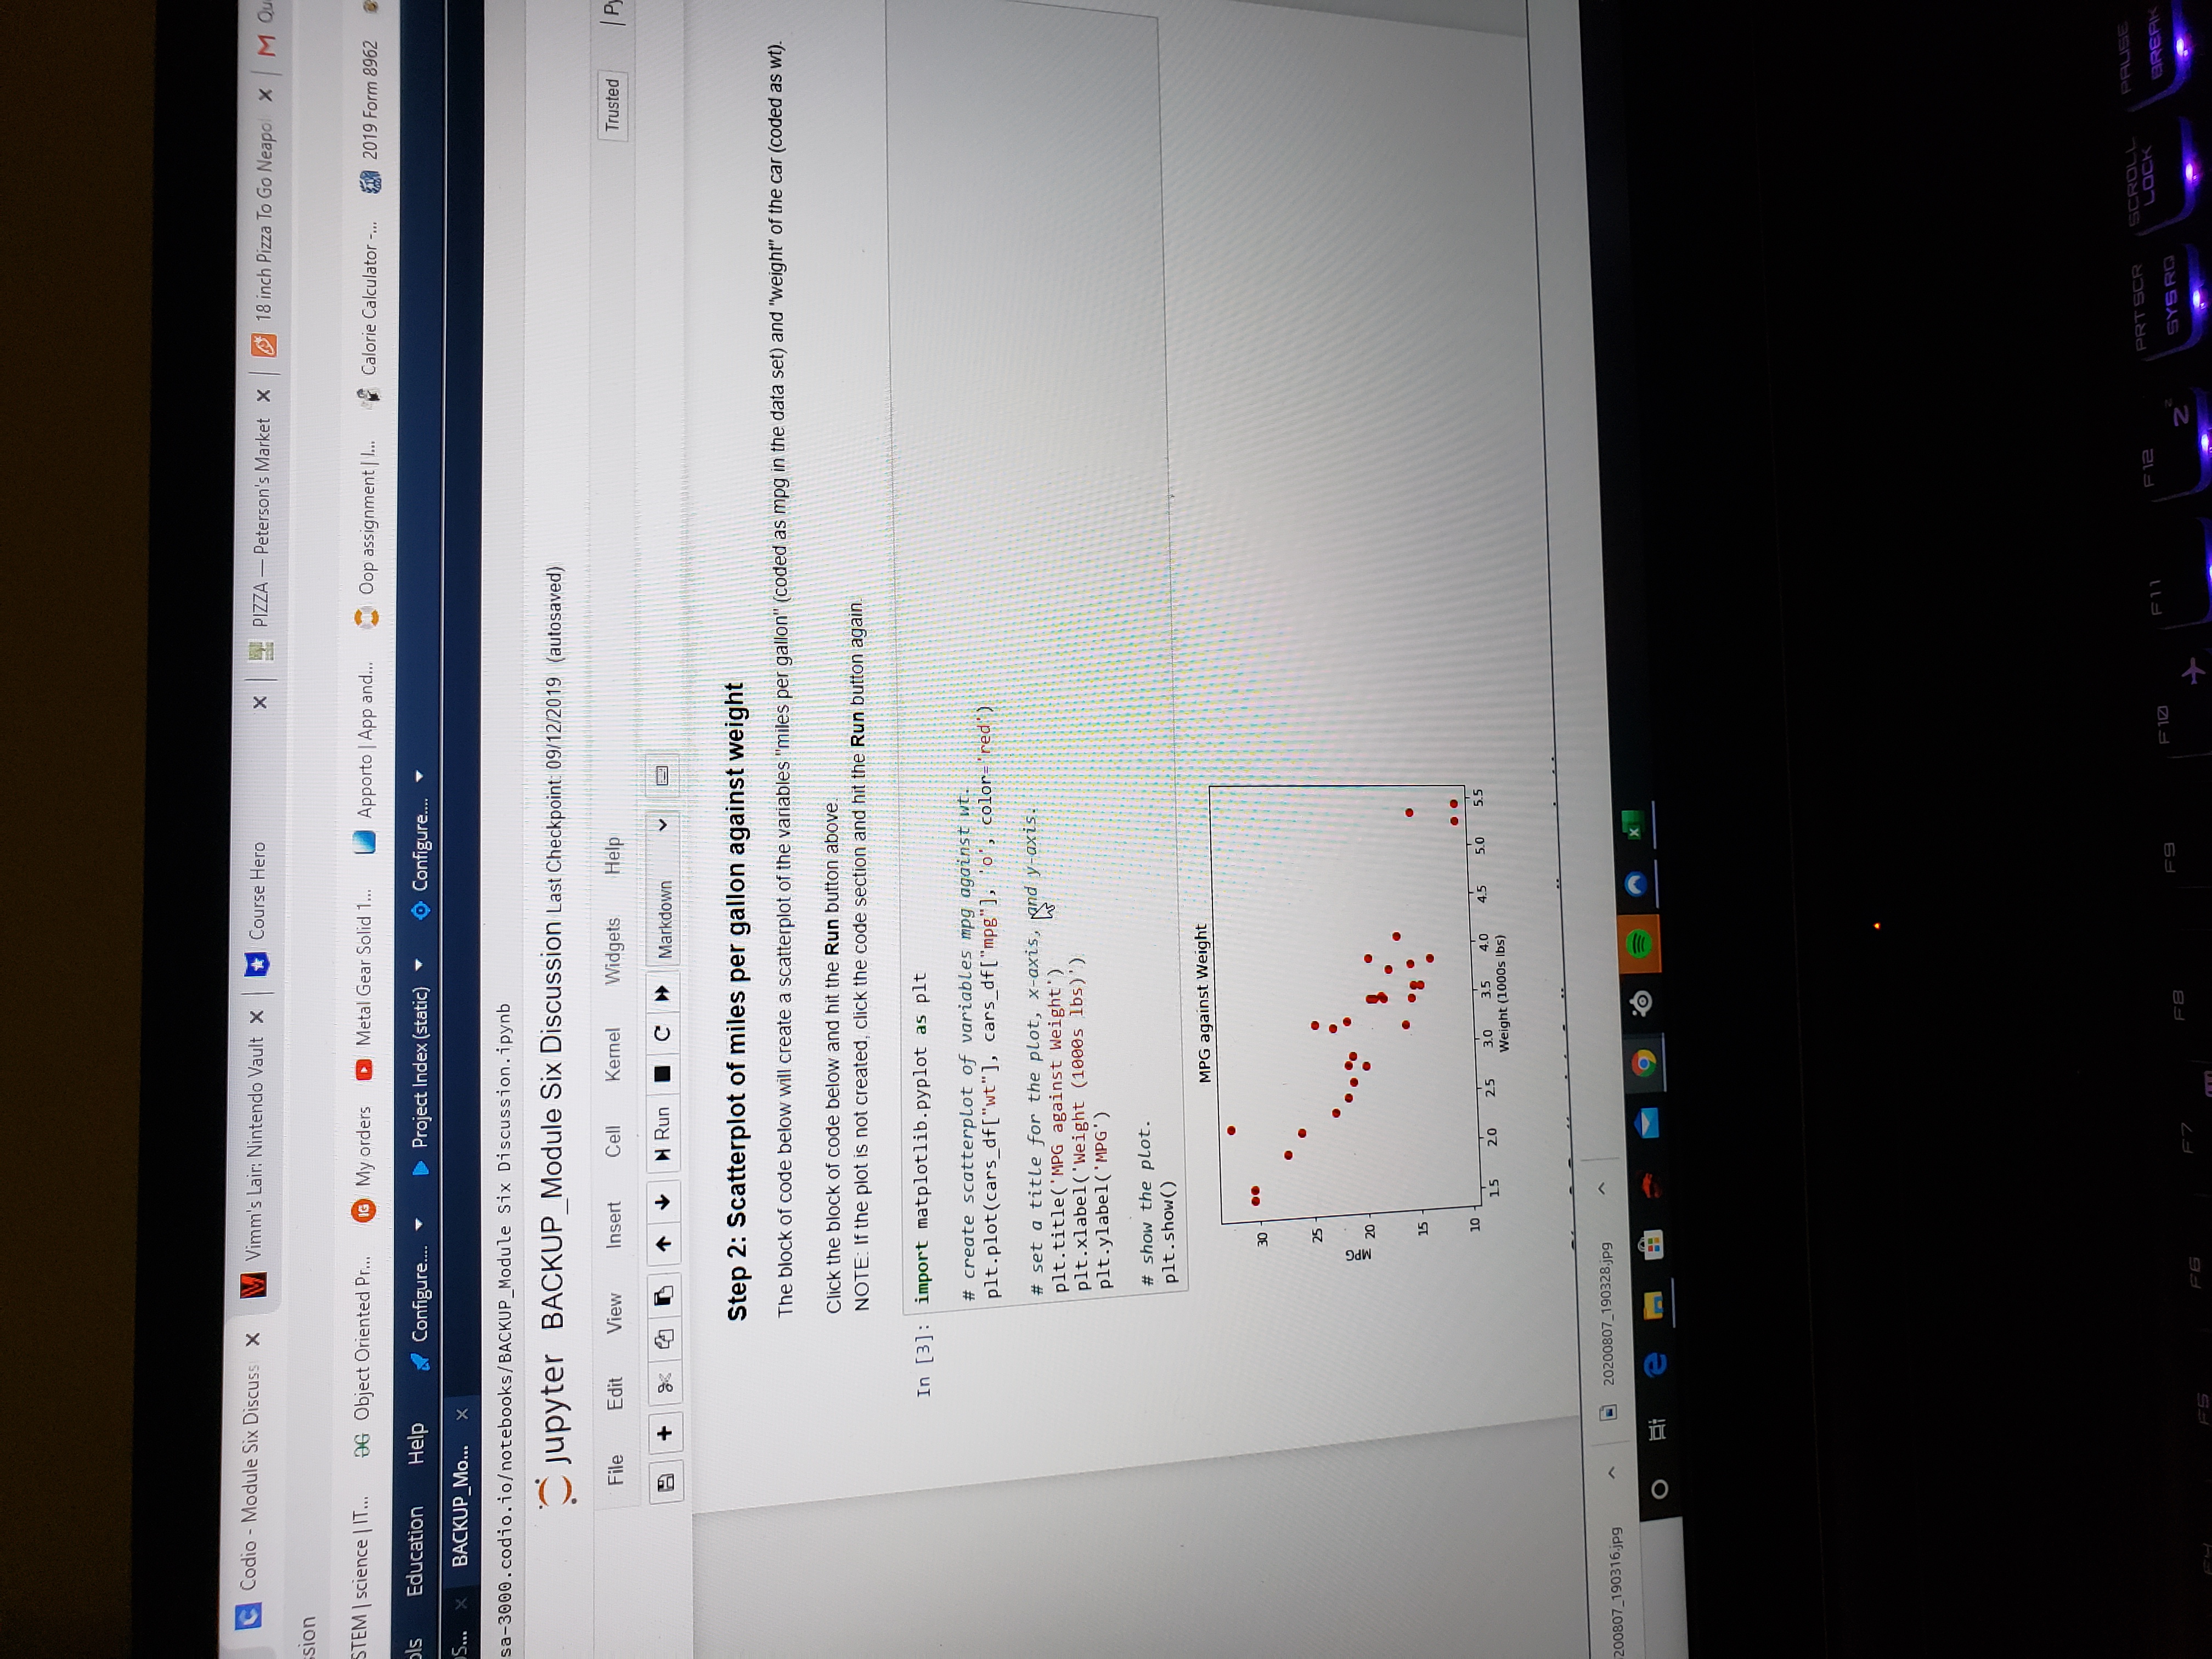
science | IT... DG Object Oriented Pr... 1G My orders Metal Gear Solid 1.,, Apporto | App and... .Oop assignment | 1... Calorie Calculator -.. / 2019 Form 2962 & Order N Education Help Configure. Project Index (static) @ Configure.. BACKUP_MO... 0 . codio. iootebooks/BACKUP_Module Six Discussion. ipynb Jupyter BACKUP_Module Six Discussion Last Checkpoint: 09/12/2019 (autosaved) File Edit View Insert Kernel Widgets Help Trusted | Python 3 a + 2 3 5 1 Run C > Markdown Step 5: Multiple regression model to predict miles per gallon using weight and horsepower This block of code produces a multiple regression model with "miles per gallon" as the response variable, and "weight" and "horsepower" as predictor variables. The ols method in statsmodels. formula.api submodule returns all statistics for this multiple regression model. Click the block of code below and hit the Run button above In [6]: from statsmodels . formula . api import ols # create the multiple regression model with mog as the response variable; weight and horsepower as predictor variables. model = ols('mpg ~ wtthp', data=cars_df).fit() print (model . summary ( ) ) OLS Regression Results Dep. Variable: mpg R-squared : 0 . 839 Model: OLS Adj. R-squared 0. 827 Method: Least Squares F-statistic: 70 .51 Date : led, 05 Aug 2020 Prob (F-statistic): 1. 91e-11 Time : 23: 40 : 38 Log-Likelihood : -66. 353 No. Observations : 30 AIC: 138.7 Of Residuals: 27 BIC: 142.9 Of Model: Covariance Type: nonrobust coef std err 0.025 0. 975] Intercept 36.0596 1.503 23.995 e. 80 32.976 39.143 wit 3.5893 .576 6.227 0.090 4.772 -2. 407 hp 0. 0308 0. 008 3.788 0.001 0.047 -0. 014 Omnibus : 6.591 Durbin-Watson: 2. 188 Prob (Omnibus) : 0. 037 Jarque-Bera (JB) : Skew : 0. 903 Prob ( JB ) : 0. 0877 Kurtosis: 3.794 Cond. No. 604 . Warnings : [1] Standard Errors assume that the covariance ors is correctly specified. End of initial post O e m X FS FI F12 PRT SCR LOCK PAUSE FB F10 SYS RO BREAK 2 ECO BACKSPACE VA 5 E R Ix & Codio - Module Six Discussion X Vimm's Lair: Nintendo Vault x | Course Hero | science | IT... DG Object Oriented Pr... IG My orders Metal Gear Solid 1... Apporto | App and... Oop assignment | I... Calorie Calculator -,.. 2019 Form 2962 @ Order Education Help Configure.. Project Index (static) * @ Configure. BACKUP_Mo... -3000 . codio. iootebooks/BACKUP_Module Six Discussion. ipynb Jupyter BACKUP_Module Six Discussion Last Checkpoint: 09/12/2019 (autosaved) File Edit View Insert Cell Kernel Widgets Help Trusted | Python a + 8 5 1 6 Run C Markdown 10 15 20 25 3.0 3.5 40 45 5.0 15 5 Weight (1000s lbs) Step 3: Scatterplot of miles per gallon against horsepower The block of code below will create a scatterplot of the variables "miles per gallon" (coded as mpg in the data set) and "horsepower" of the car (coded as hp). Click the block of code below and hit the Run button above, NOTE: If the plot is not created, click the code section and hit the Run button again In [4]: import matplotlib. pyplot as plt # create scatterplot of variables mpg against hp. pit. plot(cars_df ["hp"], cars_df ["mpg"], "o', color-"blue") # set a title for the plot, x-axis, and y-axis. pit. title('MPG against Horsepower') plt.xlabel('Horsepower' ) plt. ylabel ( 'MPG' ) # show the plot. pit . show( ) MPG against Horsepower 25 15 100 150 250 300 Horsepower O X CROLL F11 PRT SCR LOCK FB FS FS F7 2 SYS RD FH FB P ECO BACK VA I O Pscience | IT... DG Object Oriented Pr... 1G My orders Metal Gear Solid 1... Apporto | App and.. Oop assignment | I... Calorie Calculator .... 2019 Form 8962 & Orde Education Help Configure.. Project Index (static) Configure. BACKUP_MO. 00 . codio. iootebooks/BACKUP_Module Six Discussion. ipynb Jupyter BACKUP_Module Six Discussion Last Checkpoint: 09/12/2019 (autosaved) File Edit View Insert Cell Kernel Widgets Help Trusted Python N Run C > Markdown Step 1: Generating cars dataset This block of Python code will generate the sample data for you. You will not be generating the data set using numpy module this week. Instead, the data set will be imported from a CSV file. To make the data unique to you, a random sample of size 30, without replacement, will be drawn from the data in the CSV file. The data set will be saved in a Python dataframe that will be used in later calculations. Click the block of code below and hit the Run button above. In [1] : import pandas as pd from IPython . display import display, HTML # read data from mtcars. cav data set. cars_df_orig = pd. read_csv("https://53-us-west-2. amazonaws . com/data-analytics . zybooks. com/mtcars. csv") # randomly pick 30 observations from the data set to make the data set unique to you. cars_df = cars_df_orig. sample(n=30, replace=False) # print only the first five observations in the dataset. print("Cars data frame (showing only the first five observations) \ ") display(HTML(cars_df . head() . to_html())) Cars data frame (showing only the first five observations) Unnamed: 0 mpg cyl disp hp drat t asec vs am gear carb Cadillac Fleetwood 10.4 8 472.0 205 2.93 5.25 17.98 28 Ford Pantera L 15.8 8 351.0 264 4.22 3.17 14.50 17 Fiat 128 32.4 4 78.7 66 4.08 2.20 19.47 4 Hornet Sportabout 18.7 8 360.0 175 3.15 3.44 17.02 Merc 230 22.8 4 140.8 95 3.92 3.15 22.90 Step 2: Scatterplot of miles per gallon against weight The block of code below will create a scatterplot of the variables "miles per gallon" (coded as mpg in the data set) and "weight" of the car (coded as wt). Click the block of code below and hit the Run button above. NOTE: If the plot is not created, click the code section and hit the Run button again. O e 9 X PAUSE F 10 F11 F12 PRT SCR BREF FS F7 2 SYSRO ECO BACKSPF VA 5 E R T J ICodio - Module Six Discuss X Vimm's Lair: Nintendo Vault X Course Hero x PIZZA - Peterson's Market X 18 inch Pizza To Go Neapolx | M Qu sion STEM | science | IT... OG Object Oriented Pr... IG My orders Metal Gear Solid 1... Apporto | App and... Oop assignment | 1.. Calorie Calculator -... 2019 Form 8962 Education Help Configure.. Project Index (static) @ Configure.. BACKUP_Mo... sa-3000 . codio. io/ notebooks/ BACKUP_Module Six Discussion . ipynb Jupyter BACKUP_Module Six Discussion Last Checkpoint 09/12/2019 (autosaved) File Edit View Insert Cell Kernel Widgets Help Trusted a + 8 1 6 Run C Markdown Step 2: Scatterplot of miles per gallon against weight The block of code below will create a scatterplot of the variables "miles per gallon" (coded as mpg in the data set) and "weight" of the car (coded as wt). Click the block of code below and hit the Run button above NOTE: If the plot is not created, click the code section and hit the Run button again In [3] : import matplotlib. pyplot as plt # create scatterplot of variables mpg against wt. pit. plot(cars_df["wt"], cars_df["mpg"], to, color- # set a title for the plot, x-axis, and y-axis. pit. title('MPG against Weight') pit. xlabel( 'Weight (1000s 1bs)') pit .ylabel( 'MPG' ) # show the plot. pit . show( ) MPG against Weight 00 10 15 20 25 3.5 4.0 4.5 5.0 5 5 Weight (1000s Ibs ) 200807_190316.jpg 20200807_190328.jpg O e 9 PRT SCR SCROLL PAUSE F12 LOCK FB F9 F10 F11 Z SYS RD
Step by Step Solution
There are 3 Steps involved in it

Get step-by-step solutions from verified subject matter experts