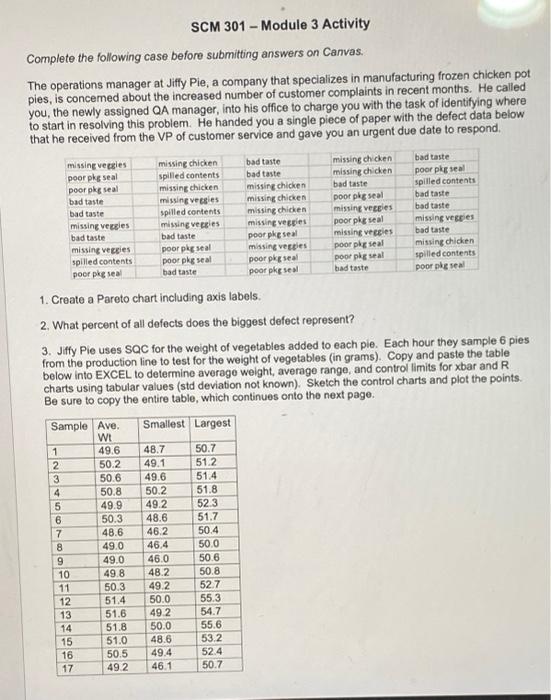
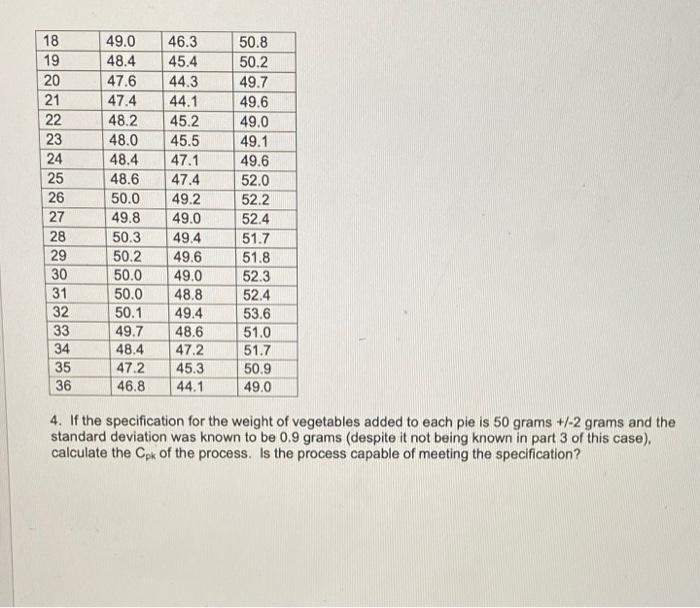
Question: SCM 301 - Module 3 Activity Complete the following case before submitting answers on Canvas. The operations manager at Jiffy Ple, a company that specializes

SCM 301 - Module 3 Activity Complete the
SCM 301 - Module 3 Activity Complete the following case before submitting answers on Canvas. The operations manager at Jiffy Ple, a company that specializes in manufacturing frozen chicken pot ples, is concemed about the increased number of customer complaints in recent months. He called you, the newly assigned QA manager, into his office to charge you with the task of identifying where to start in resolving this problem. He handed you a single piece of paper with the defect data below that he received from the VP of customer service and gave you an urgent due date to respond. missing vegles poor ple seal poor pkk seal bad taste bad taste missing vegles bad taste missing veggies spilled contents poor pe seal missing chicken spilled contents missing chicken missing vessies spilled contents missing veces bad taste poor ple seal poor plg seal bad taste bad taste bad taste missing chicken missing chicken missing chicken missing vergies poor pe seal missing veggies poor pe seal poor pe seal missing chicken missing chicken bad taste poor plg seal missing vegles poor ple seal missing veeeles poor ple seal poor plg seal bad taste bad taste poor pledeal spilled contents bad taste bad taste missing veces bad taste missing chicken spilled contents poor ple seal 1. Create a Pareto chart including axis labels. 2. What percent of all defects does the biggest defect represent? 3. Jiffy Pie uses SQC for the weight of vegetables added to each pie. Each hour they sample 6 pies from the production line to test for the weight of vegetables (in grams). Copy and paste the table below into EXCEL to determine average weight, average range, and controllimits for Xbar and R charts using tabular values (std deviation not known). Sketch the control charts and plot the points. Be sure to copy the entire table, which continues onto the next page. Sample Ave. Smallest Largest WI 1 49.6 48.7 50.7 2 50.2 49.1 51.2 3 50.6 49.6 51.4 4 50.8 50.2 51.8 5 49.9 49.2 523 6 50.3 48.6 51.7 7 48.6 46.2 50.4 8 49.0 46.4 50.0 49.0 46.0 50.6 10 49.8 48.2 50.8 11 50.3 49.2 52.7 12 51.4 50.0 55.3 13 51.6 49 2 54.7 14 51.8 50.0 55.6 15 51.0 48.6 53.2 16 50.5 49.4 52.4 17 492 46.1 50.7 18 19 20 21 22 23 24 25 26 27 28 29 30 31 32 33 34 35 36 49.0 48.4 47.6 47.4 48.2 48.0 48.4 48.6 50.0 49.8 50.3 50.2 50.0 50.0 50.1 49.7 48.4 472 46.8 46.3 45.4 44.3 44.1 45.2 45.5 47.1 47.4 49.2 49.0 50.8 50.2 49.7 49.6 49.0 49.1 49.6 52.0 52.2 52.4 51.7 51.8 52.3 52.4 53.6 51.0 51.7 50.9 49.0 49.4 49.6 49.0 48.8 49.4 48.6 47.2 45.3 44.1 4. If the specification for the weight of vegetables added to each pie is 50 grams +/-2 grams and the standard deviation was known to be 0.9 grams (despite it not being known in part 3 of this case), calculate the Cpk of the process. Is the process capable of meeting the specification

Step by Step Solution

There are 3 Steps involved in it

1 Expert Approved Answer
Step: 1 Unlock blur-text-image
Question Has Been Solved by an Expert!

Get step-by-step solutions from verified subject matter experts

Step: 2 Unlock
Step: 3 Unlock

Students Have Also Explored These Related General Management Questions!