

Question: Score: U Next Question The table shows differences in political ideology, by education, for a random sample of voters. Use the data to solve the
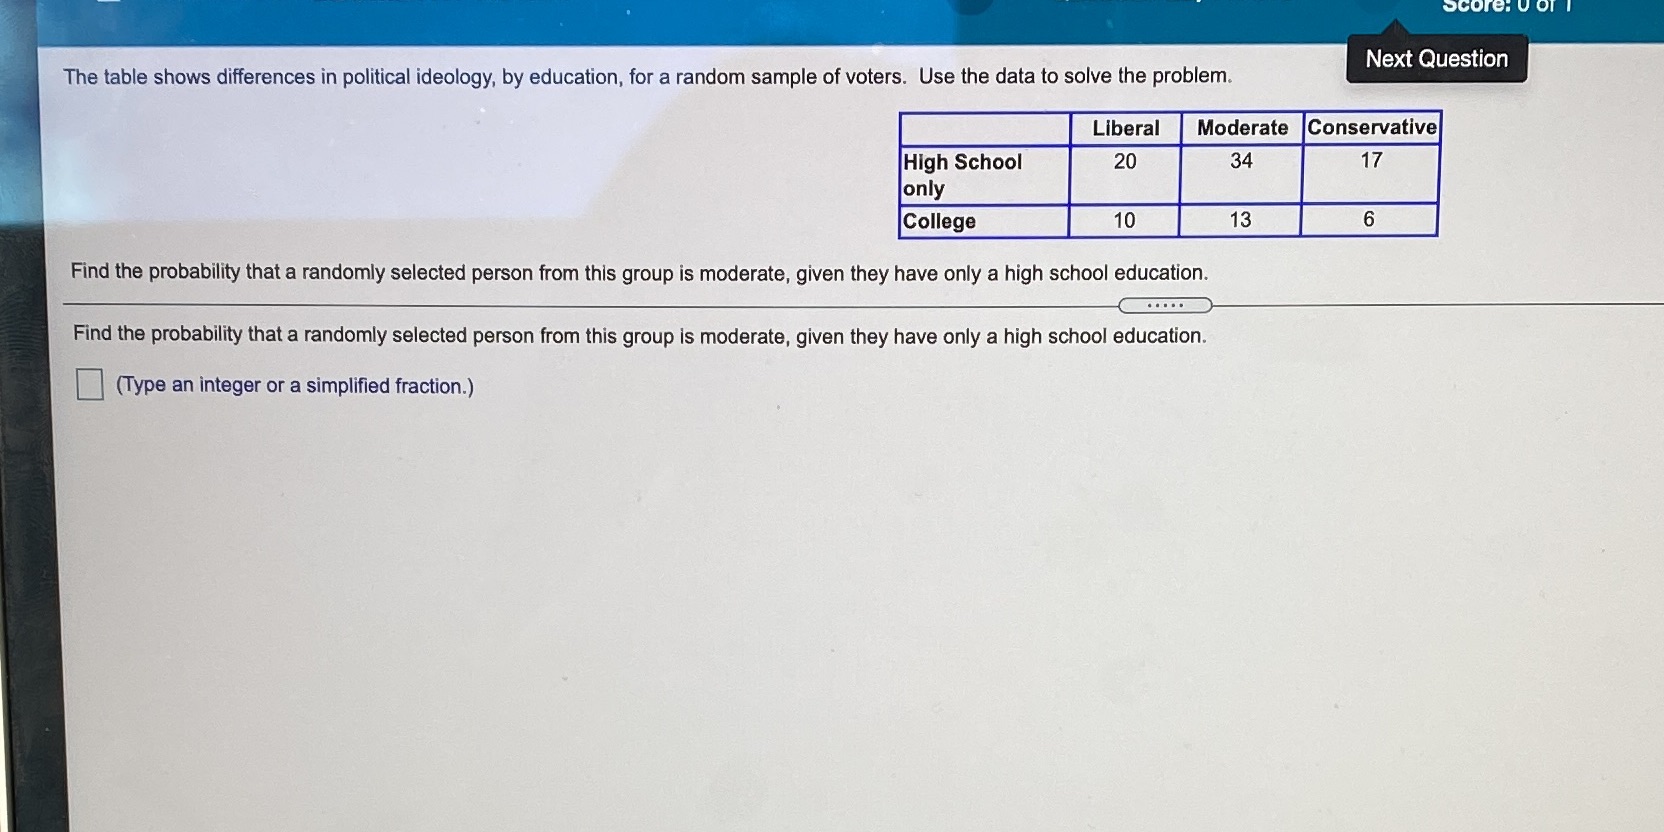
Score: U Next Question The table shows differences in political ideology, by education, for a random sample of voters. Use the data to solve the problem. Liberal Moderate Conservative High School 20 34 17 only College 10 13 6 Find the probability that a randomly selected person from this group is moderate, given they have only a high school education. Find the probability that a randomly selected person from this group is moderate, given they have only a high school education. (Type an integer or a simplified fraction.)
Step by Step Solution
There are 3 Steps involved in it
1 Expert Approved Answer
Step: 1 Unlock

Question Has Been Solved by an Expert!
Get step-by-step solutions from verified subject matter experts
Step: 2 Unlock
Step: 3 Unlock