

Question: Screenshots are provided here as attached. Suppose that an educational researcher knows the average class size and average achievement test scores from five elementary schools
Screenshots are provided here as attached. Suppose that an educational researcher knows the average class size and average achievement
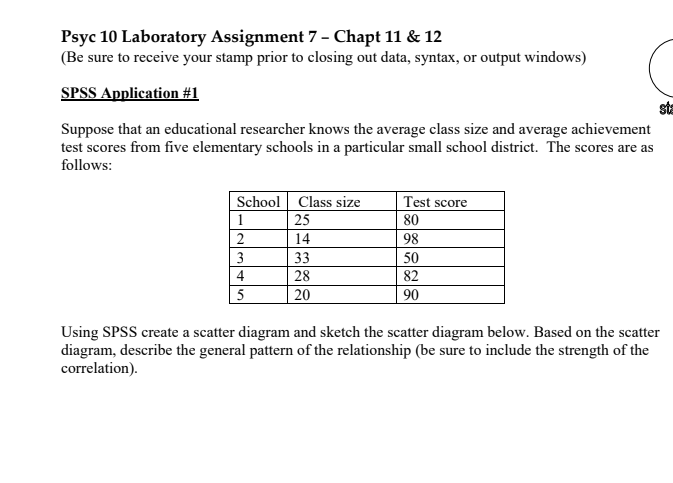
test scores from five elementary schools in a particular small school district. The scores are as
follows:
School Class size Test score
1 25 80
2 14 98
3 33 50
4 28 82
5 20 90
Using SPSS, scatter diagram and sketch the scatter diagram below. Based on the scatter
diagram, describe the general pattern of the relationship (be sure to include the strength.
Psycl10 Laboratory Assignment 7 - Chapt 11 & 12 (Be sure to receive your stamp prior to closing out data, syntax, or output windows) SPSS Application #1 st Suppose that an educational researcher knows the average class size and average achievement test scores from five elementary schools in a particular small school district. The scores are as follows: School Class size Test score 25 80 2 14 98 3 33 50 4 28 82 5 20 90 Using SPSS create a scatter diagram and sketch the scatter diagram below. Based on the scatter diagram, describe the general pattern of the relationship (be sure to include the strength of the correlation).\f
Step by Step Solution
There are 3 Steps involved in it

Get step-by-step solutions from verified subject matter experts