

Question: SEARCH Flash Memory, Inc. Case 1. Assuming the company does not invest in the new product line, prepare forecasted income statements and balance sheets at
SEARCH Flash Memory, Inc. Case
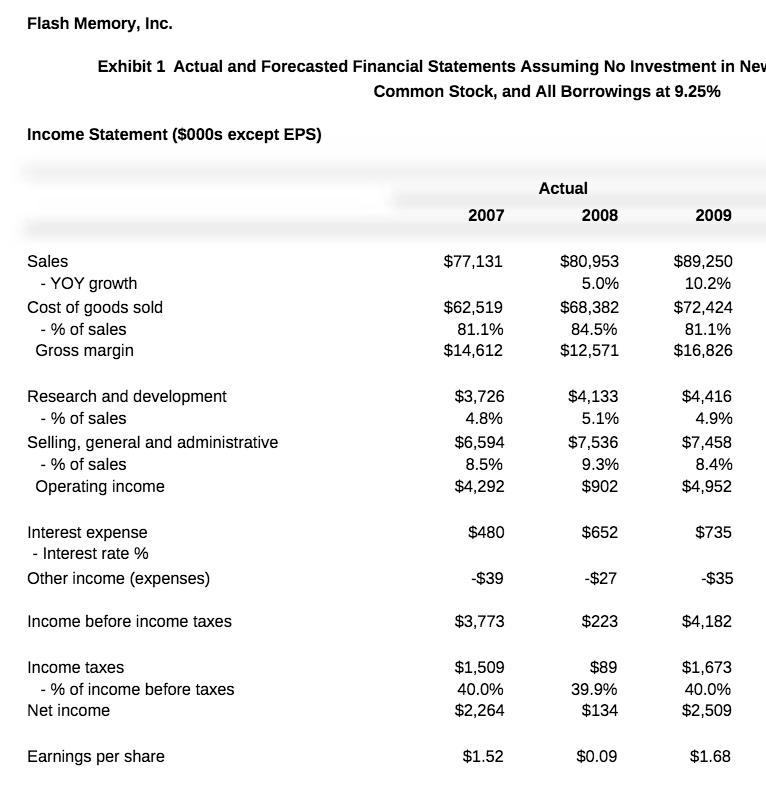
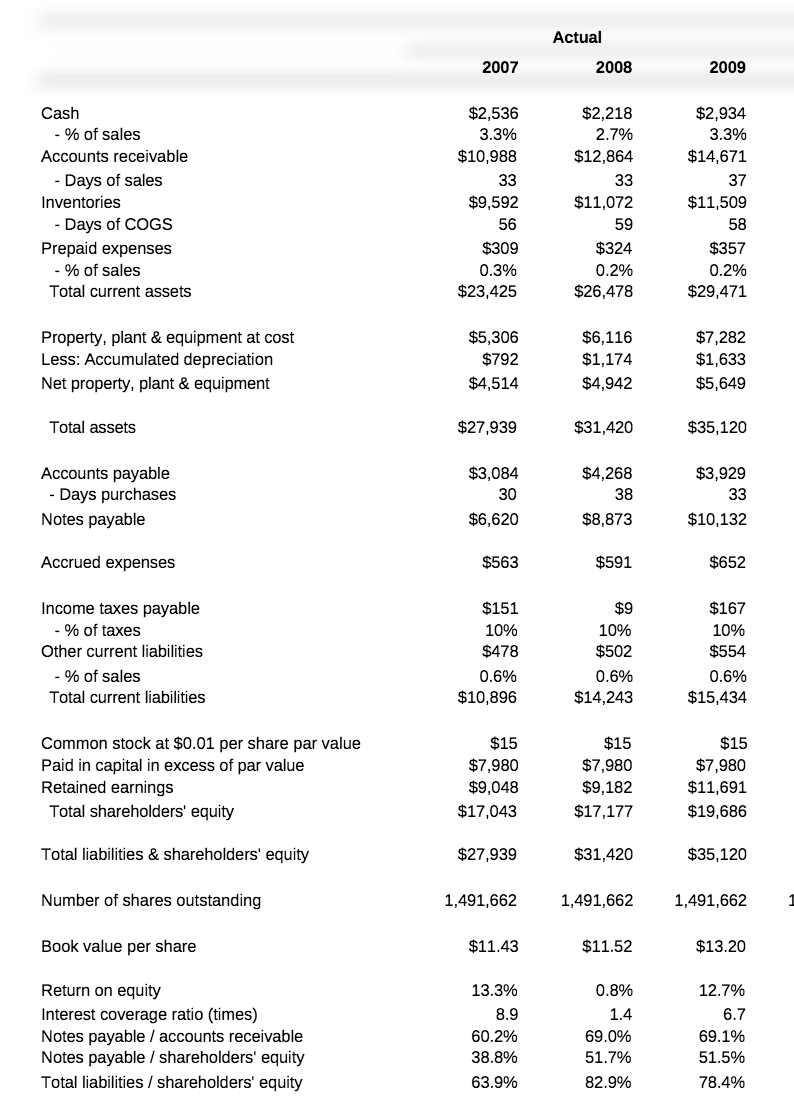
1. Assuming the company does not invest in the new product line, prepare forecasted income statements and balance sheets at year-end 2010, 2011, and 2012. Based on these forecasts, estimate Flashs required external financing: in this case all required external financing takes the form of additional notes payable form its commercial bank, for the same period.
2. What course of action do you recommend regarding the proposed investment in the new product line? Should the company accept or reject this investment opportunity?
3. How does your recommendation from question 2 above impact your estimate of the companys forecasted income statements and balance sheets, and required external financing in 2010, 2011, and 2012? How do these forecasted income statements and balance sheets differ if the company relies solely on additional notes payable from its commercial bank, compared to a sale of new equity?
4. As CFO Hathaway Browne, what financing alternative would you recommend to the board of the directors to meet the financing needs you estimated in questions 1 through 3 above? What are the costs and benefits of each alternative?
| xhibit 3 Key Forecasting Assumptions and Relationships for 2010 Through 2012 | |
| Line Item | Assumption or Ratio |
| Cost of goods sold | 81.10% of sales |
| Research and development | 5.0% of sales |
| Selling, general and administrative | 8.36% of sales |
| Interest expense | Beginning of year debt balance interest rate |
| Other income (expenses) | $50,000 of expense each year |
| Cash | 3.3% of sales |
| Accounts receivable | 60 days sales outstanding |
| Inventories | 52 days of cost of good sold |
| Prepaid expenses | 0.4% of sales |
| Property, plant & equipment at cost | Beginning PP&E at cost + capital expenditures |
| Accumulated depreciation | Beginning A/D + 7.5% of beginning PP&E at cost |
| Accounts payable | 30 days of purchases |
| Purchases | 60% of cost of goods sold |
| Accrued expenses | 0.73% of sales |
| Income taxes payable | 10% of income taxes expense |
| Other current liabilities | 0.62% of sales |
Actual 2007 2008 2009 Cash - % of sales Accounts receivable - Days of sales Inventories - Days of COGS Prepaid expenses - % of sales Total current assets $2,536 3.3% $10,988 33 $9,592 56 $2.218 2.7% $12,864 33 $11,072 59 $324 0.2% $26,478 $2,934 3.3% $14,671 37 $11,509 58 $309 0.3% $23,425 $357 0.2% $29,471 Property, plant & equipment at cost Less: Accumulated depreciation Net property, plant & equipment $5,306 $792 $4,514 $6,116 $1,174 $4,942 $7,282 $1,633 $5,649 Total assets $27,939 $31,420 $35,120 $3,084 $3,929 Accounts payable - Days purchases Notes payable 30 $4,268 38 $8,873 33 $6,620 $10,132 Accrued expenses $563 $591 $652 $151 Income taxes payable - % of taxes Other current liabilities - % of sales Total current liabilities 10% $478 0.6% $10,896 $9 10% $502 0.6% $14,243 $167 10% $554 0.6% $15,434 $15 Common stock at $0.01 per share par value Paid in capital in excess of par value Retained earnings Total shareholders' equity $15 $7,980 $9,048 $17,043 $7,980 $9,182 $17,177 $15 $7,980 $11,691 $19,686 Total liabilities & shareholders' equity $27,939 $31,420 $35,120 Number of shares outstanding 1,491,662 1,491,662 1,491,662 Book value per share $11.43 $11.52 $13.20 12.7% 6.7 Return on equity Interest coverage ratio (times) Notes payable / accounts receivable Notes payable / shareholders' equity Total liabilities / shareholders' equity 13.3% 8.9 60.2% 38.8% 63.9% 0.8% 1.4 69.0% 51.7% 82.9% 69.1% 51.5% 78.4% Actual 2007 2008 2009 Cash - % of sales Accounts receivable - Days of sales Inventories - Days of COGS Prepaid expenses - % of sales Total current assets $2,536 3.3% $10,988 33 $9,592 56 $2.218 2.7% $12,864 33 $11,072 59 $324 0.2% $26,478 $2,934 3.3% $14,671 37 $11,509 58 $309 0.3% $23,425 $357 0.2% $29,471 Property, plant & equipment at cost Less: Accumulated depreciation Net property, plant & equipment $5,306 $792 $4,514 $6,116 $1,174 $4,942 $7,282 $1,633 $5,649 Total assets $27,939 $31,420 $35,120 $3,084 $3,929 Accounts payable - Days purchases Notes payable 30 $4,268 38 $8,873 33 $6,620 $10,132 Accrued expenses $563 $591 $652 $151 Income taxes payable - % of taxes Other current liabilities - % of sales Total current liabilities 10% $478 0.6% $10,896 $9 10% $502 0.6% $14,243 $167 10% $554 0.6% $15,434 $15 Common stock at $0.01 per share par value Paid in capital in excess of par value Retained earnings Total shareholders' equity $15 $7,980 $9,048 $17,043 $7,980 $9,182 $17,177 $15 $7,980 $11,691 $19,686 Total liabilities & shareholders' equity $27,939 $31,420 $35,120 Number of shares outstanding 1,491,662 1,491,662 1,491,662 Book value per share $11.43 $11.52 $13.20 12.7% 6.7 Return on equity Interest coverage ratio (times) Notes payable / accounts receivable Notes payable / shareholders' equity Total liabilities / shareholders' equity 13.3% 8.9 60.2% 38.8% 63.9% 0.8% 1.4 69.0% 51.7% 82.9% 69.1% 51.5% 78.4%
Step by Step Solution
There are 3 Steps involved in it

Get step-by-step solutions from verified subject matter experts