

Question: Search this course tivity: Project risk analysis x Video Excel Online Structured Activity: Project risk analysis The Butler-Perkins Company (BPC) must decide between two mutually
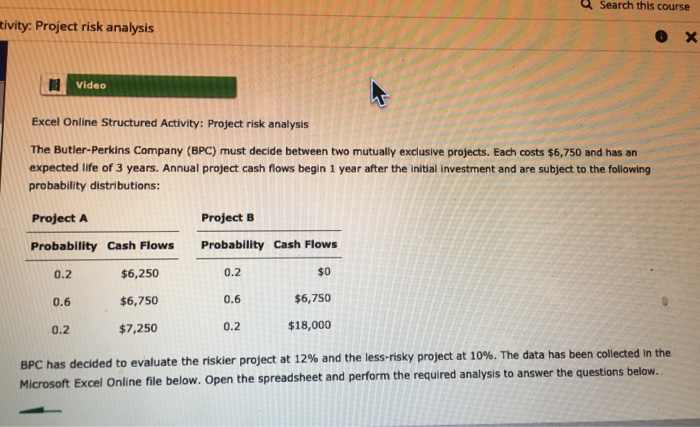
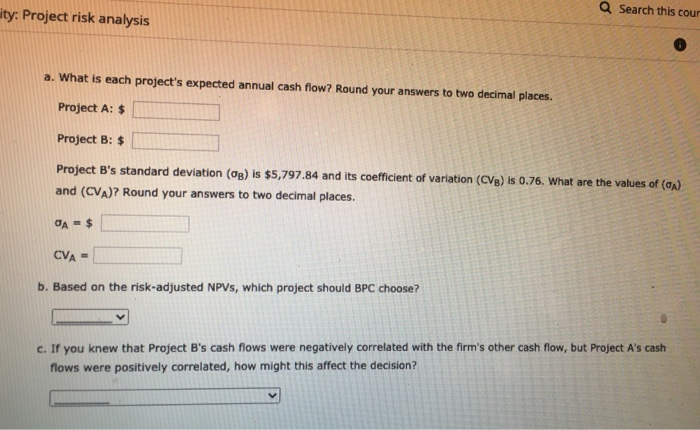
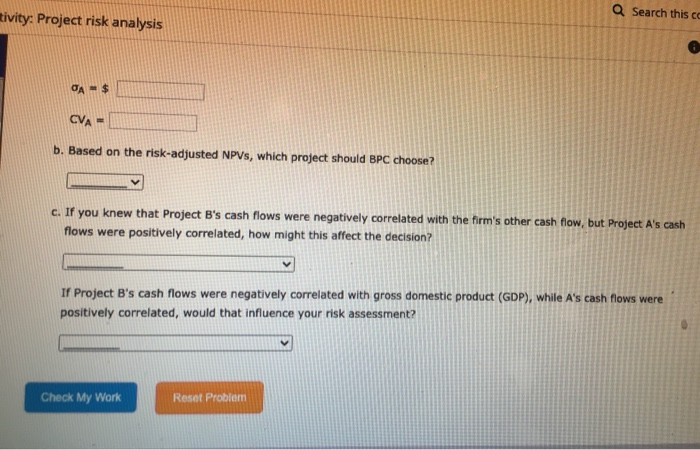
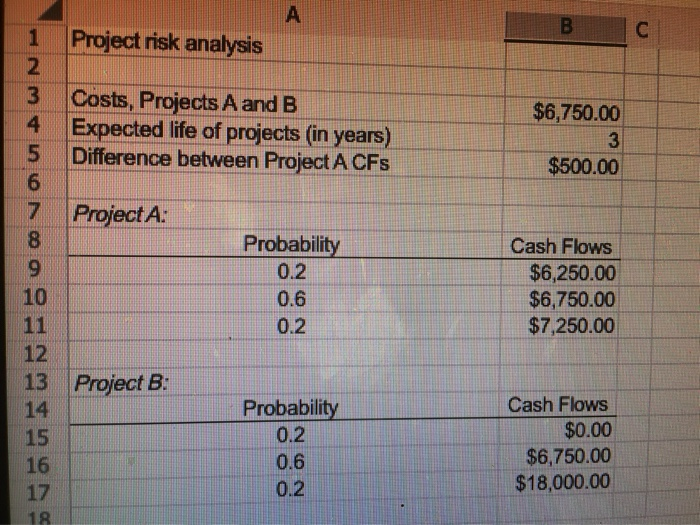
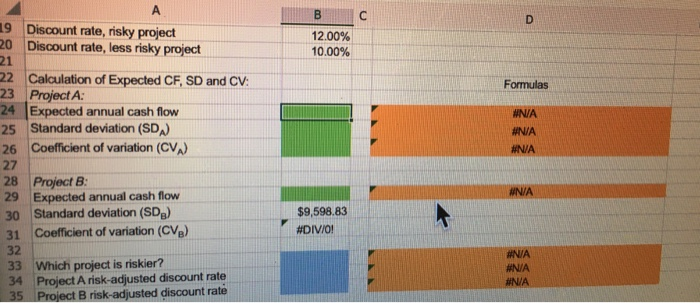
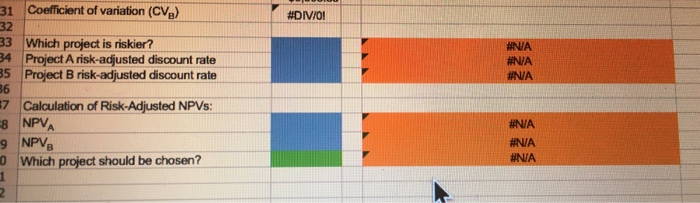
Search this course tivity: Project risk analysis x Video Excel Online Structured Activity: Project risk analysis The Butler-Perkins Company (BPC) must decide between two mutually exclusive projects. Each costs $6,750 and has an expected life of 3 years. Annual project cash flows begin 1 year after the initial investment and are subject to the following probability distributions: Project A Project B Probability Cash Flows Probability Cash Flows 0.2 $6,250 0.2 $0 0.6 $6,750 0.6 $6,750 0.2 $7,250 0.2 $18,000 BPC has decided to evaluate the riskier project at 12% and the less-risky project at 10%. The data has been collected in the Microsoft Excel Online file below. Open the spreadsheet and perform the required analysis to answer the questions below. ity: Project risk analysis Q Search this cour a. What is each project's expected annual cash flow? Round your answers to two decimal places. Project A: $ Project B: $ Project B's standard deviation (Og) is $5,797.84 and its coefficient of variation (CVB) is 0.76. What are the values of (CA) and (CVA)? Round your answers to two decimal places. JA - $ CVA = b. Based on the risk-adjusted NPVs, which project should BPC choose? c. If you knew that Project B's cash flows were negatively correlated with the firm's other cash flow, but Project A's cash flows were positively correlated, how might this affect the decision? Q Search this cc tivity: Project risk analysis OA - $ CVA- b. Based on the risk-adjusted NPVs, which project should BPC choose? c. If you knew that Project B's cash flows were negatively correlated with the firm's other cash flow, but Project A's cash flows were positively correlated, how might this affect the decision? If Project B's cash flows were negatively correlated with gross domestic product (GDP), while A's cash flows were positively correlated, would that influence your risk assessment? Check My Work Reset Problem B C Project risk analysis 1 2 3 4 5 6 7 8 9 10 Costs, Projects A and B Expected life of projects in years) Difference between Project A CFs $6,750.00 3 $500.00 Project A: Probability 0.2 0.6 0.2 Cash Flows $6,250.00 $6,750.00 $7.250.00 12 13 Project B: 14 15 16 17 Probability 0.2 0.6 0.2 Cash Flows $0.00 $6,750.00 $18,000.00 18 B D 12.00% 10.00% Formulas #NA #N/A #N/A 19 Discount rate, risky project 20 Discount rate, less risky project 21 22 Calculation of Expected CF, SD and CV: 23 Project A: 24 Expected annual cash flow 25 Standard deviation (SD) 26 Coefficient of variation (CV) 27 28 Project B: 29 Expected annual cash flow 30 Standard deviation (SD) 31 Coefficient of variation (CV) 32 33 Which project is riskier? 34 Project A risk-adjusted discount rate 35 Project B risk-adjusted discount rate #N/A $9,598.83 #DIV/0! #N/A #N/A #N/A #DIV/OI #NA #N/A #NA 31 Coefficient of variation (CV) 32 33 Which project is riskier? 34 Project A risk-adjusted discount rate 85 Project B risk-adjusted discount rate 36 7 Calculation of Risk-Adjusted NPVs: 8 NPVA 9 NPVB 0 Which project should be chosen? #N/A #NA #N/A 2
Step by Step Solution
There are 3 Steps involved in it

Get step-by-step solutions from verified subject matter experts