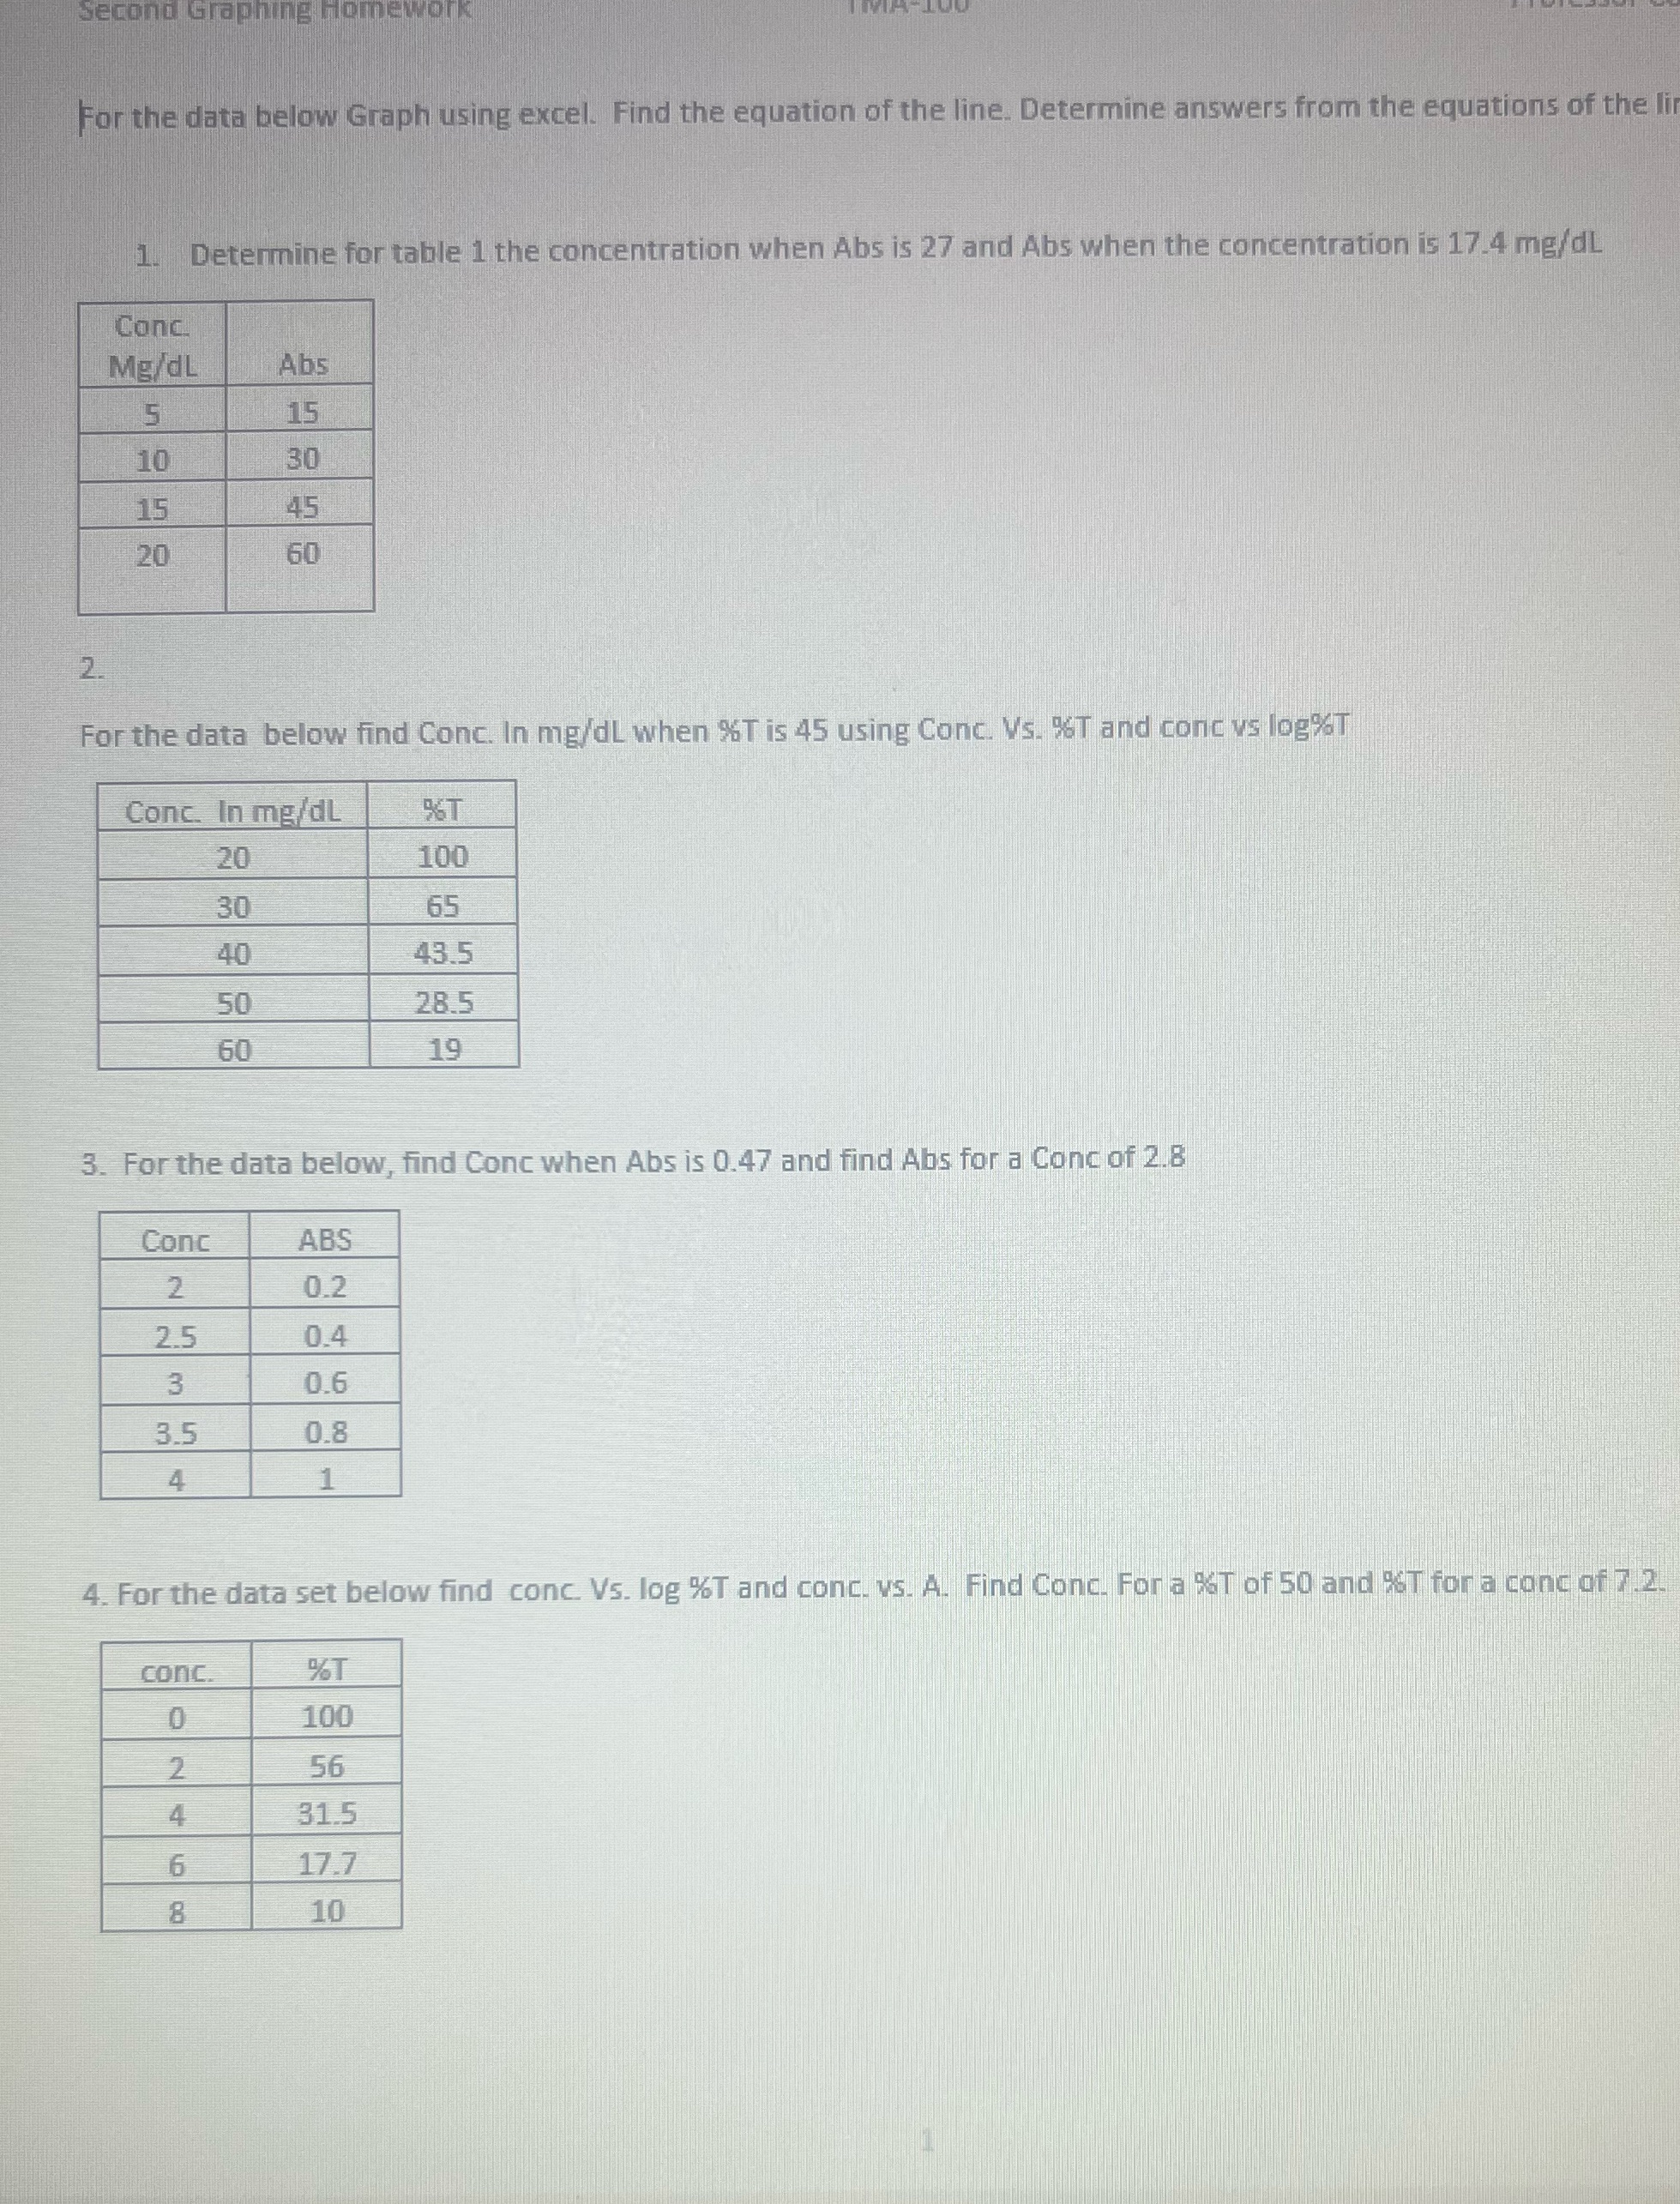
Question: Second Graphing For the data below Graph using excel. Find the equation of the line. Determine answers from the equations of the li 1. Determine

Second Graphing For the data below Graph using
Second Graphing For the data below Graph using excel. Find the equation of the line. Determine answers from the equations of the li 1. Determine for table 1 the concentration when Abs is 27 and Abs when the concentration is 17.4 mg/dL Conc Mg/dL Abs 5 15 10 30 15 45 20 60 2. For the data below find Conc. In mg/dL when %T is 45 using Conc. Vs. "T and cone vs logT Conc. In me/dl 9%T 20 100 30 65 40 43.5 50 28.5 60 19 3. For the data below, find Conc when Abs is 0.47 and find Abs for a Conc of 2.8 Conc ABS 2 0.2 2.5 0.4 3 0.6 3.5 0.8 4 4. For the data set below find conc. Vs. log %T and conc. vs. A. Find Conc, For a *T of 50 and IST for a conc of 7.2. conc. %T 0 100 2 56 4 31.5 6 17.7 10

Step by Step Solution

There are 3 Steps involved in it

1 Expert Approved Answer
Step: 1 Unlock blur-text-image
Question Has Been Solved by an Expert!

Get step-by-step solutions from verified subject matter experts

Step: 2 Unlock
Step: 3 Unlock

Students Have Also Explored These Related Mathematics Questions!