

Question: Second Homework Assignment Economics 120 Fall 2020 A. Competitive Equilibrium in the Market for Illinois Wine The demand and supply schedules for Illinois wine are
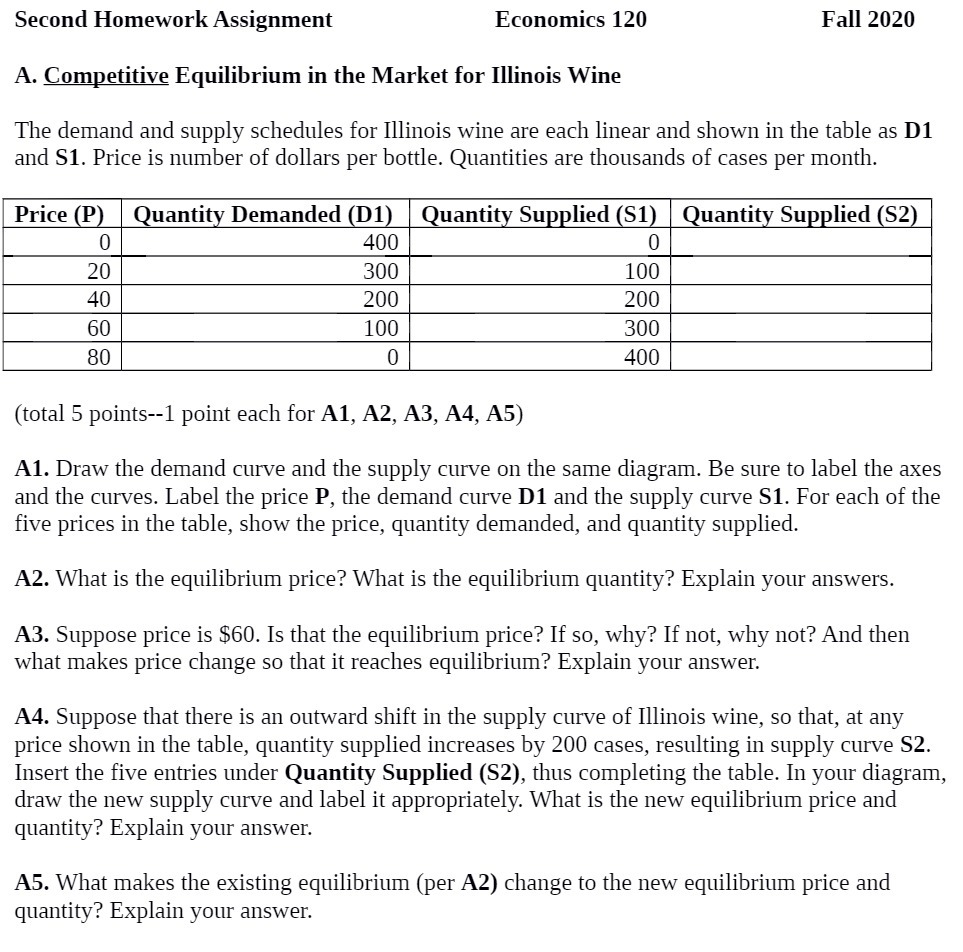

Second Homework Assignment Economics 120 Fall 2020 A. Competitive Equilibrium in the Market for Illinois Wine The demand and supply schedules for Illinois wine are each linear and shown in the table as D1 and S]. Price is number of dollars per bottle. Quantities are thousands of cases per month. m loanti Demanded D1 Iuanti SuIIlied Sl Quanti SuIIlied S2 .I_I 300 100 200 (total 5 points--1 point each for Al, A2, A3, A4, A5) A1. Draw the demand curve and the supply curve on the same diagram. Be sure to label the axes and the curves. Label the price P, the demand curve D1 and the supply curve 51. For each of the five prices in the table, show the price, quantity demanded, and quantity supplied. A2. What is the equilibrium price? What is the equilibrium quantity? Explain your answers. A3. Suppose price is $60. Is that the equilibrium price? If so, why? If not, why not? And then what makes price change so that it reaches equilibrium? Explain your answer. A4. Suppose that there is an outward shift in the supply curve of Illinois wine, so that, at any price shown in the table, quantity supplied increases by 200 cases, resulting in supply curve 52. Insert the five entries under Quantity Supplied (S2), thus completing the table. In your diagram, draw the new supply curve and label it appropriately. What is the new equilibrium price and quantity? Explain your answer. A5. What makes the existing equilibrium (per A2) change to the new equilibrium price and quantity? Explain your
Step by Step Solution
There are 3 Steps involved in it

Get step-by-step solutions from verified subject matter experts