

Question: second image is for average expenses per year thrid image is tor salvage market values of the forklift last two images go together A manufacturer
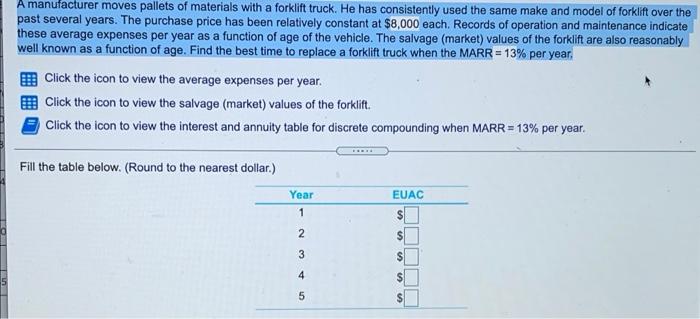
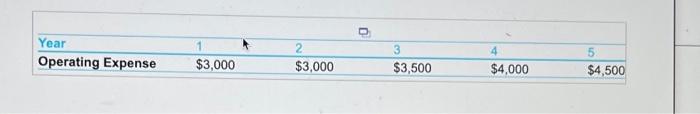
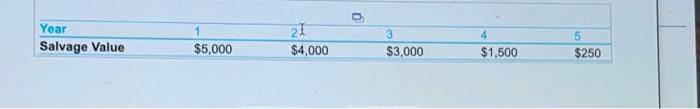
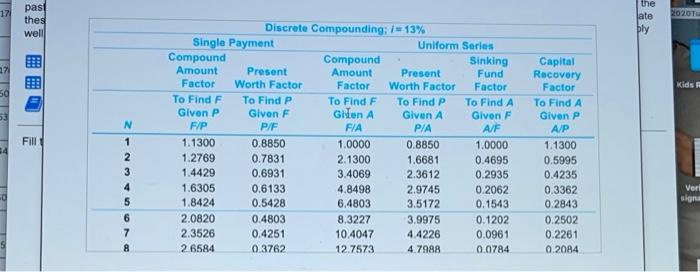
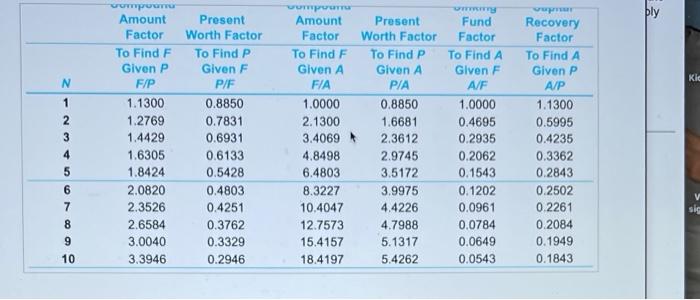
A manufacturer moves pallets of materials with a forklift truck. He has consistently used the same make and model of forklift over the past several years. The purchase price has been relatively constant at $8,000 each. Records of operation and maintenance indicate these average expenses per year as a function of age of the vehicle. The salvage (market) values of the forklift are also reasonably well known as a function of age. Find the best time to replace a forklift truck when the MARR = 13% per year, Click the icon to view the average expenses per year. 6 Click the icon to view the salvage (market) values of the forklift Click the icon to view the interest and annuity table for discrete compounding when MARR = 13% per year. Fill the table below. (Round to the nearest dollar.) EUAC Year 1 $ 2 $ 3 S CAW N 4 $ 5 Year Operating Expense 1 $3,000 $3,000 3 $3,500 4 $4,000 5 $4,500 0 Year Salvage Value 1 $5,000 21 $4,000 3 $3,000 4 $1,500 $250 12 pasi the late 202014 thes well ply 7 Kids 50 Fill N 1 2 3 4 5 Discrete Compounding; i = 13% Single Payment Uniform Series Compound Compound Sinking Amount Present Amount Present Fund Factor Worth Factor Factor Worth Factor Factor To Find F To Find P To Find F To Find P To Find A Given P Given F Gilen A Given A Given F F/P P/F FIA P/A AF 1.1300 0.8850 1.0000 0.8850 1.0000 1.2769 0.7831 2.1300 1.6681 0.4695 1.4429 0.6931 3.4069 2.3612 0.2935 1.6305 0.6133 4.8498 2.9745 0.2062 1.8424 0.5428 6.4803 3.5172 0.1543 2.0820 0.4803 8.3227 3.9975 0.1202 2.3526 0.4251 10.4047 4.4226 0.0961 2 6584 0.3762 12.7573 4.7988 0.0784 Capital Recovery Factor To Find A Given P A/P 1.1300 0.5995 0.4235 0.3362 0.2843 0.2502 0.2261 0.2014 Verl signu 6 07 8 ply Kic N 1 2 3 wompuum Amount Factor To Find F Given P F/P 1.1300 1.2769 1.4429 1.6305 1.8424 2.0820 2.3526 2.6584 3.0040 3.3946 Present Worth Factor To Find P Given F P/F 0.8850 0.7831 0.6931 0.6133 0.5428 0.4803 0.4251 0.3762 0.3329 0.2946 Amount Factor To Find F Given A F/A 1.0000 2.1300 3.4069 4.8498 6.4803 8.3227 10.4047 12.7573 15.4157 18.4197 Present Worth Factor To Find P Given A PIA 0.8850 1.6681 2.3612 2.9745 3.5172 3.9975 4.4226 4.7988 5.1317 5.4262 Fund Factor To Find A Glven F A/F 1.0000 0.4695 0.2935 0.2062 0.1543 0.1202 0.0961 0.0784 0.0649 0.0543 Recovery Factor To Find A Given P A/P 1.1300 0.5995 0.4235 0.3362 0.2843 0.2502 0.2261 0.2084 0.1949 0.1843 4 5 6 7 8 9 10 sic
Step by Step Solution
There are 3 Steps involved in it

Get step-by-step solutions from verified subject matter experts