

Question: Second image is the the Z Values table required for the question. Demand for vanilla ice cream at a small ice cream shop can be
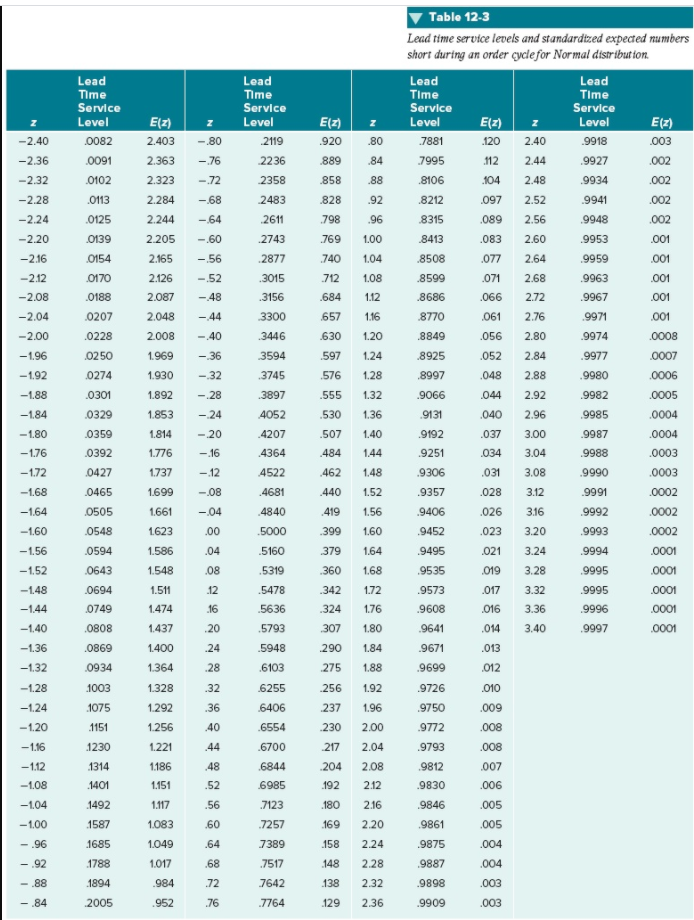 Second image is the the Z Values table required for the question.
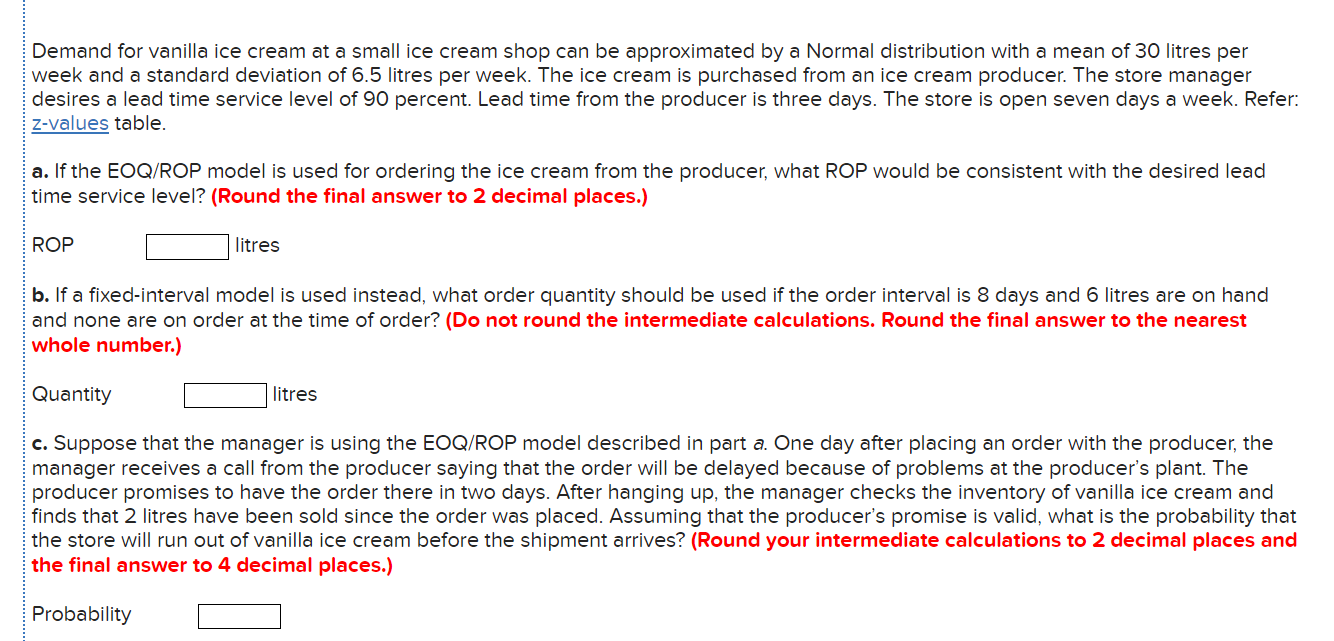
Demand for vanilla ice cream at a small ice cream shop can be approximated by a Normal distribution with a mean of 30 litres per week and a standard deviation of 6.5 litres per week. The ice cream is purchased from an ice cream producer. The store manager desires a lead time service level of 90 percent. Lead time from the producer is three days. The store is open seven days a week. Refer: Z-values table. a. If the EOQ/ROP model is used for ordering the ice cream from the producer, what ROP would be consistent with the desired lead time service level? (Round the final answer to 2 decimal places.) ROP litres b. If a fixed-interval model is used instead, what order quantity should be used if the order interval is 8 days and 6 litres are on hand and none are on order at the time of order? (Do not round the intermediate calculations. Round the final answer to the nearest whole number.) Quantity litres c. Suppose that the manager is using the EOQ/ROP model described in part a. One day after placing an order with the producer, the manager receives a call from the producer saying that the order will be delayed because of problems at the producer's plant. The producer promises to have the order there in two days. After hanging up, the manager checks the inventory of vanilla ice cream and finds that 2 litres have been sold since the order was placed. Assuming that the producer's promise is valid, what is the probability that the store will run out of vanilla ice cream before the shipment arrives? (Round your intermediate calculations to 2 decimal places and the final answer to 4 decimal places.) Probability Z E(z) .920 -2.40 -2.36 Lead Time Service Level 2119 2236 2358 2483 -2.32 -2.28 E(z) 2.403 2.363 2.323 2.284 2.244 2.205 2.165 2.126 2.087 -.80 -76 -72 -68 -64 .889 .858 .828 .798 .80 .84 .88 92 .96 -2.24 -.60 .769 1.00 -2.20 -2.16 -2.12 2611 .2743 2877 .3015 3156 1.04 -.56 -.52 -.48 -44 .740 712 .684 1.08 -2.08 Lead Time Service Level 0082 .0091 .0102 .0113 .0125 0139 0154 0170 .0188 0207 .0228 0250 0274 .0301 .0329 .0359 .0392 0427 .0465 0505 .0548 1.12 -2.04 2.048 3300 .657 1.16 -2.00 2.008 -.40 .630 1.20 3446 3594 -1.96 1.969 - 36 .597 1.24 -1.92 1.930 - 32 .576 1.28 -1.88 .555 1.32 1.892 1.853 1.814 -28 - 24 -184 Table 12-3 Lead time service levels and standardized expected numbers short during an order cycle for Normal distribution Lead Lead Time Time Service Service Level E(z) Level E(z) .7881 .120 2.40 .9918 .003 7995 .112 2.44 .9927 .002 .8106 .104 2.48 9934 .002 .8212 097 2.52 9941 .002 8315 .089 2.56 9948 .002 .8413 .083 2.60 .9953 .001 8508 .077 2.64 .9959 .001 8599 .071 2.68 9963 .001 .8686 .066 2.72 .9967 .001 8770 .061 2.76 9971 .001 .8849 .056 2.80 .9974 .0008 .8925 .052 2.84 .9977 0007 .8997 .048 2.88 .9980 .0006 .9066 .044 2.92 .9982 .0005 -9131 .040 2.96 9985 .0004 .9192 .037 3.00 .9987 .0004 9251 034 3.04 .9988 .0003 .9306 .031 3.08 .9990 .0003 .9357 .028 3.12 19991 .0002 .9406 .026 19992 .0002 9452 .023 3.20 .9993 .0002 .9495 .021 3.24 .9994 .0001 .9535 .019 3.28 .9995 .0001 9573 .017 3.32 .9995 .0001 .9608 .016 3.36 9996 .0001 .9641 .014 3.40 9997 .0001 .9671 .013 .9699 .012 9726 .010 9750 .009 .008 19793 .008 9812 2007 .9830 .006 3745 3897 4052 .4207 4364 4522 -1.80 -20 -1.76 1.776 -.16 .530 .507 484 462 440 1.36 1.40 1.44 1.48 1.52 -1.72 -1.68 -1.64 1.737 1.699 1.661 1.623 - 12 -.08 -04 .00 4681 4840 .5000 1.56 3.16 419 399 -1.60 1.60 .0594 1.586 .04 379 1.64 -1.56 -1.52 .5160 .5319 .0643 08 360 1.68 1.548 1.511 .0694 .12 342 1.72 -1.48 -1.44 -1.40 0749 1.474 .16 .5478 .5636 .5793 .324 1.76 .0808 1.437 .20 307 1.80 -1.36 .0869 1.400 .24 .5948 .290 1.84 -1.32 .0934 1.364 .28 .6103 275 1.88 -1.28 .1003 1.328 .32 .6255 256 1.92 1075 1.292 .36 6406 .237 1.96 -1.24 - 1.20 .1151 1.256 .40 .6554 230 2.00 .9772 -1.16 44 217 1230 .1314 -1.12 1.221 1.186 1.151 .48 .204 .6700 .6844 6985 .7123 2.04 2.08 2.12 -1.08 .1401 .52 .192 .1492 1.117 .56 .180 2.16 -1.04 -1.00 9846 9861 .005 .005 .60 .7257 .169 2.20 -.96 .64 7389 .158 2.24 .004 .1587 1685 .1788 .1894 .2005 1.083 1.049 1.017 984 .68 2.28 - 92 -.88 .004 .7517 7642 .9875 9887 .9898 148 .138 .72 2.32 .003 -84 952 .76 .7764 .129 2.36 .9909 .003
Step by Step Solution
There are 3 Steps involved in it

Get step-by-step solutions from verified subject matter experts