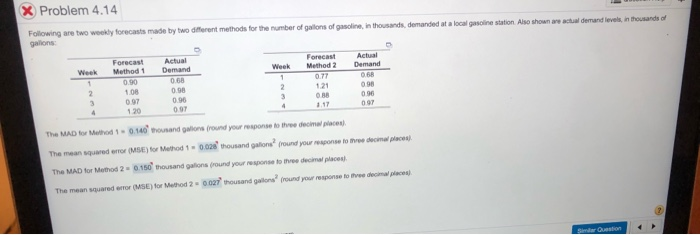
Question: second picture is to show steps X Problem 4.14 Question He Following are two weekly forecasts made by two different methods for the number of

second picture is to show steps second picture is to show steps X Problem 4.14
second picture is to show steps X Problem 4.14
X Problem 4.14 Question He Following are two weekly forecasts made by two different methods for the number of gallons of gasoline, in thousands, demanded at a local gasoline station. Also shown are actual demand levels in thousands gallons Week 1 2 3 Forecast Method 1 085 1.02 0.97 120 Actual Demand 0.70 1.05 0.96 1.00 Week 1 2 3 4 Forecast Method 2 0.82 1.20 0.90 1.11 Actual Demand 0.70 1.05 0.96 1.00 The MAD for Method 1 - thousand galions (round your response to throw decimal places) Enter your answer in the aryswer box and then click Check Answer CERA Clear All parts remaining X Problem 4.14 Following are two weekly forecasts made by two different methods for the number of gallons of gasoline, in thousands, demanded at a local gasoline station Also shown are actual demand levels in thousands of gallons 0.96 Forecast Actual Forecast Actual Week Method 1 Demand Week Method 2 Demand 0.90 0.68 1 2 1.08 0.90 2 1.21 3 097 0.30 0.90 120 097 0.97 The MAD to Method 10.148 and is round your response to the decimal places The measured (NSE) for Muthod 1 0.028 thousand gaton round your response to three decima aces) The MAD for Method 20.150 thousand gallons round your response to three decimal place The mean squared error (ME) for Method 2 0027thousand gallons round your response to live decimal places Serion

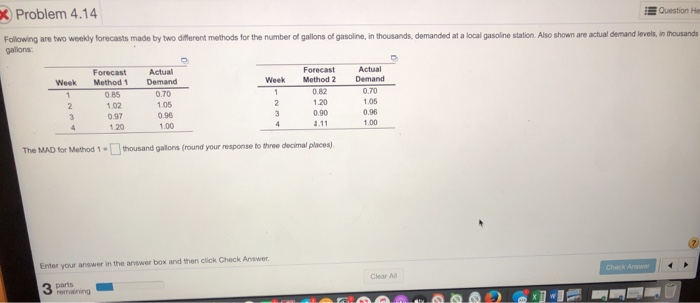
Step by Step Solution

There are 3 Steps involved in it

1 Expert Approved Answer
Step: 1 Unlock blur-text-image
Question Has Been Solved by an Expert!

Get step-by-step solutions from verified subject matter experts

Step: 2 Unlock
Step: 3 Unlock

Students Have Also Explored These Related General Management Questions!