

Question: Secondly, find the mean absolute deviation (MAD) and mean squared error (MSE). MAD MSE Thirdly, find and analyze the tracking signal (TS). TS According to
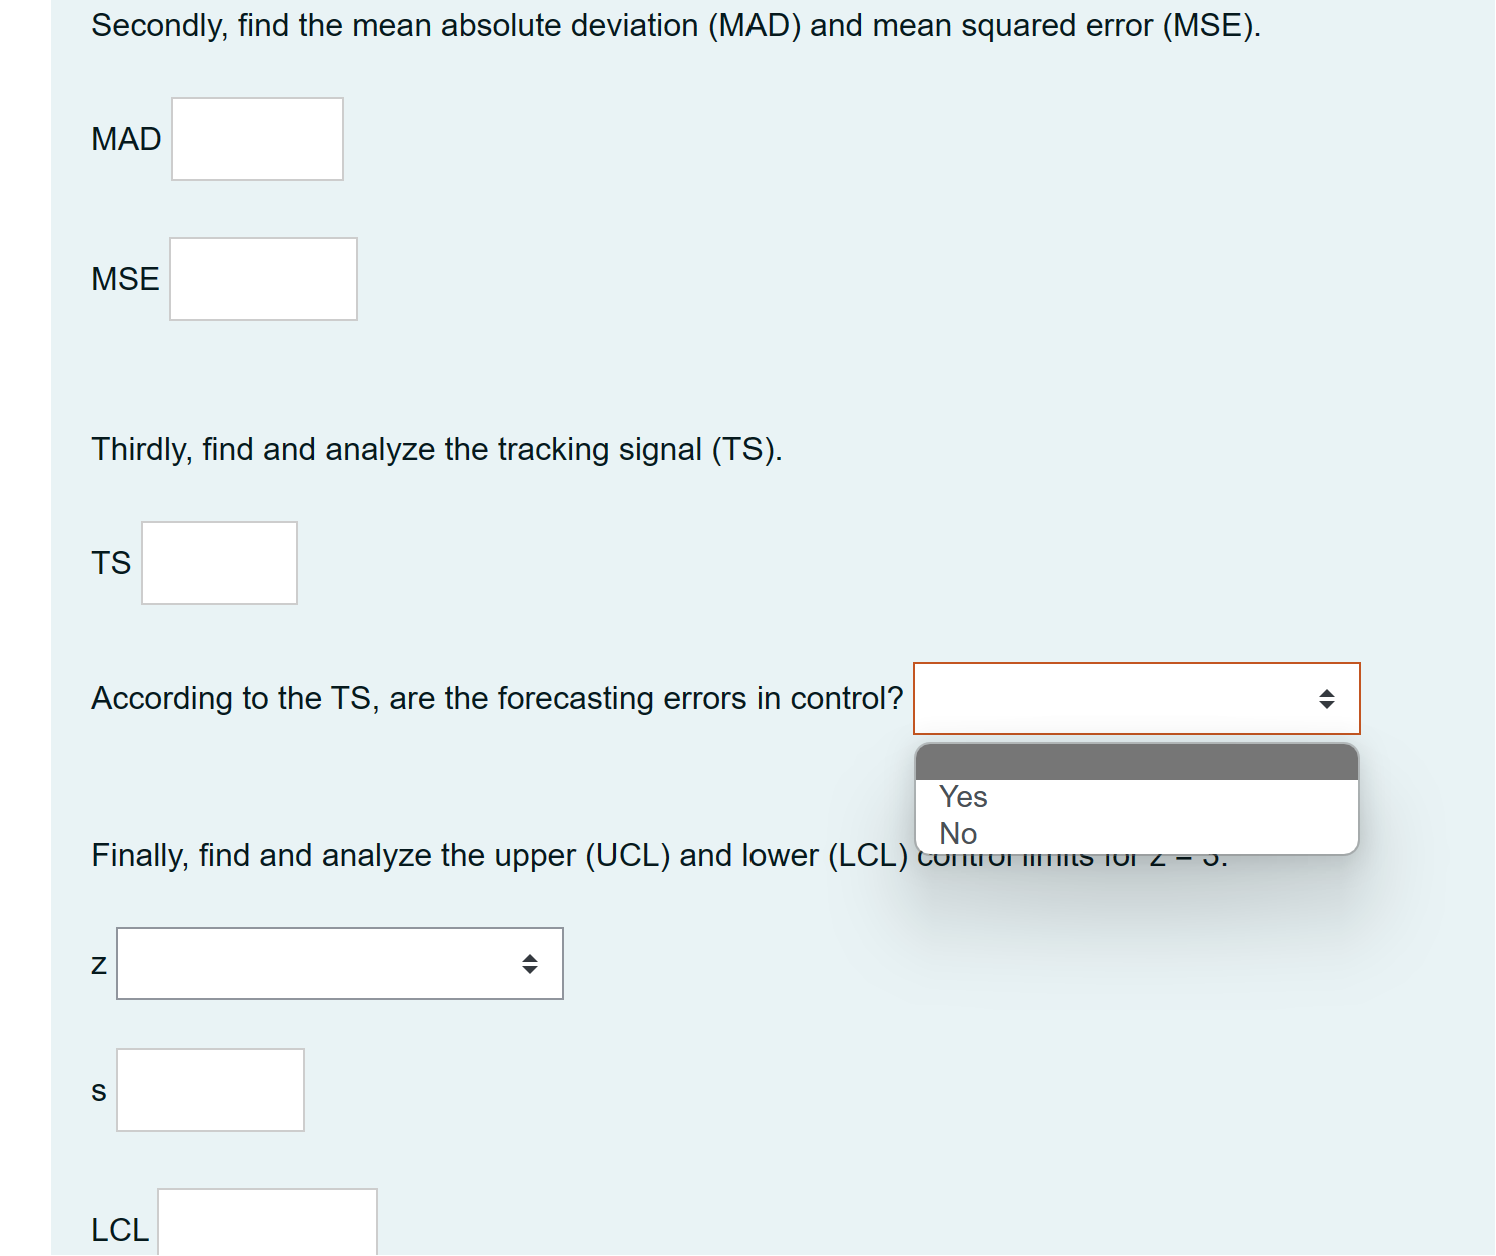
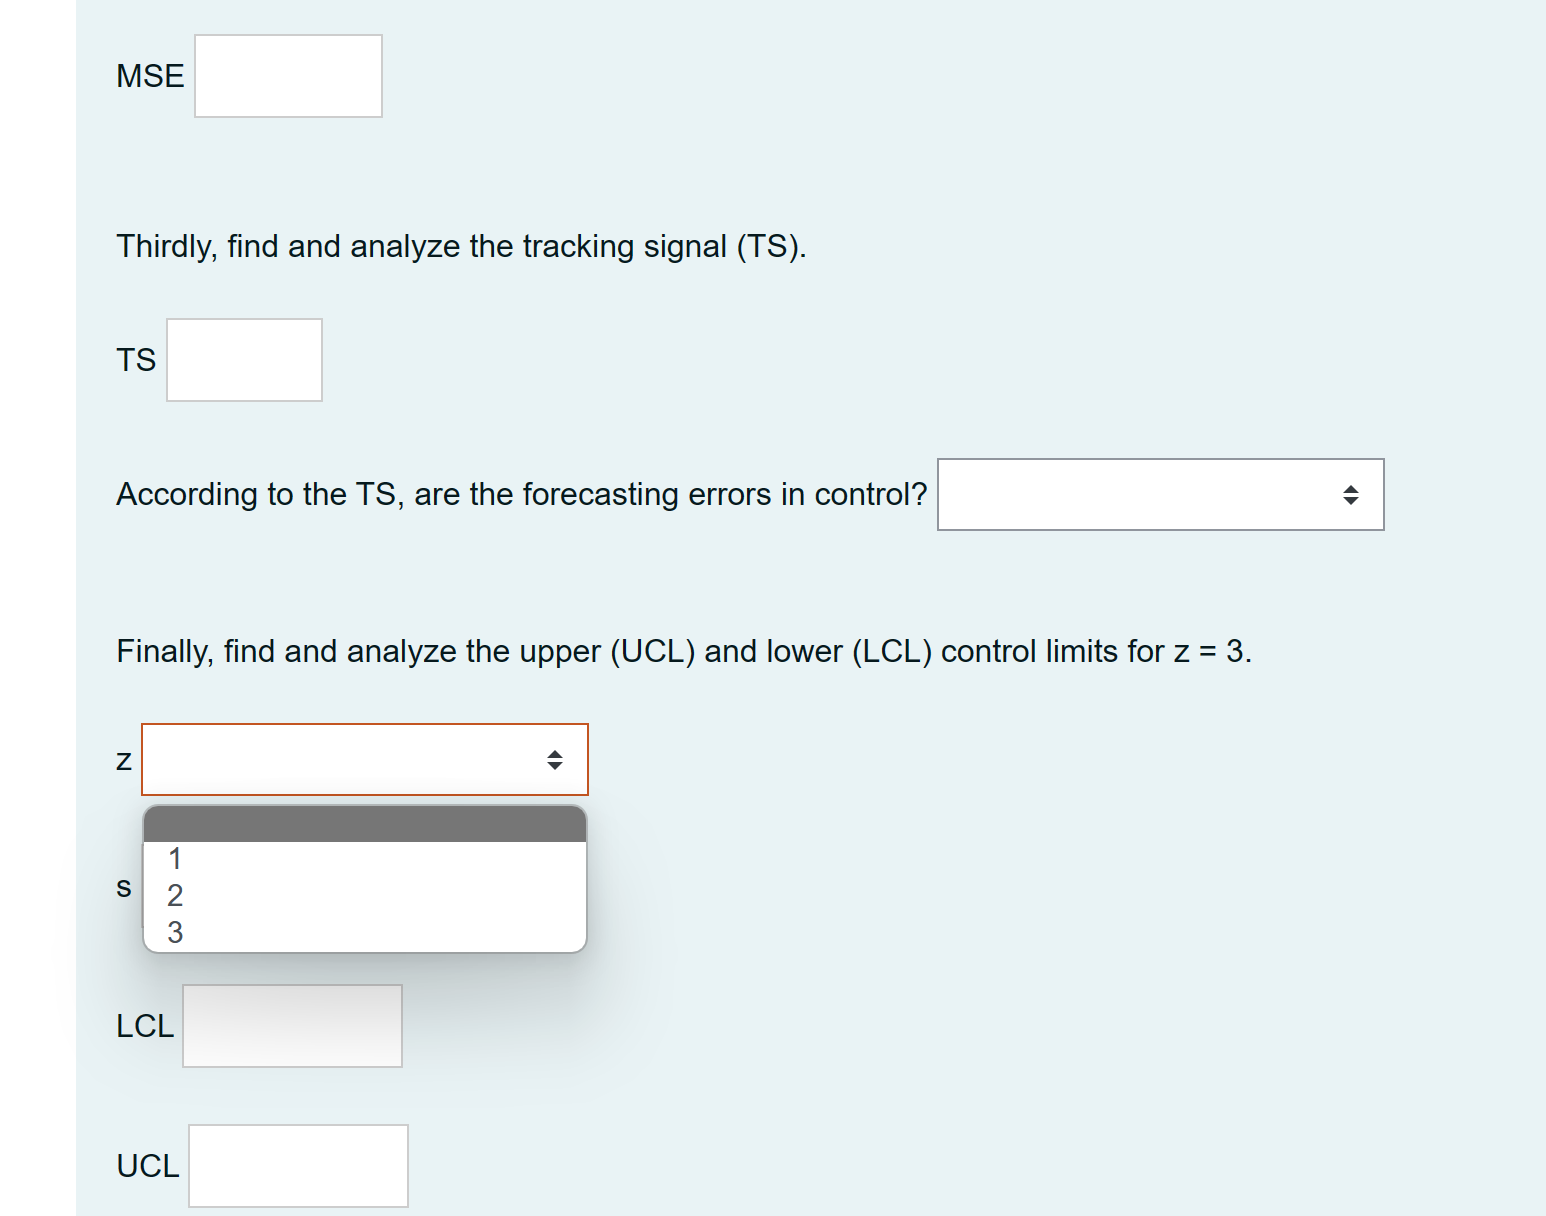
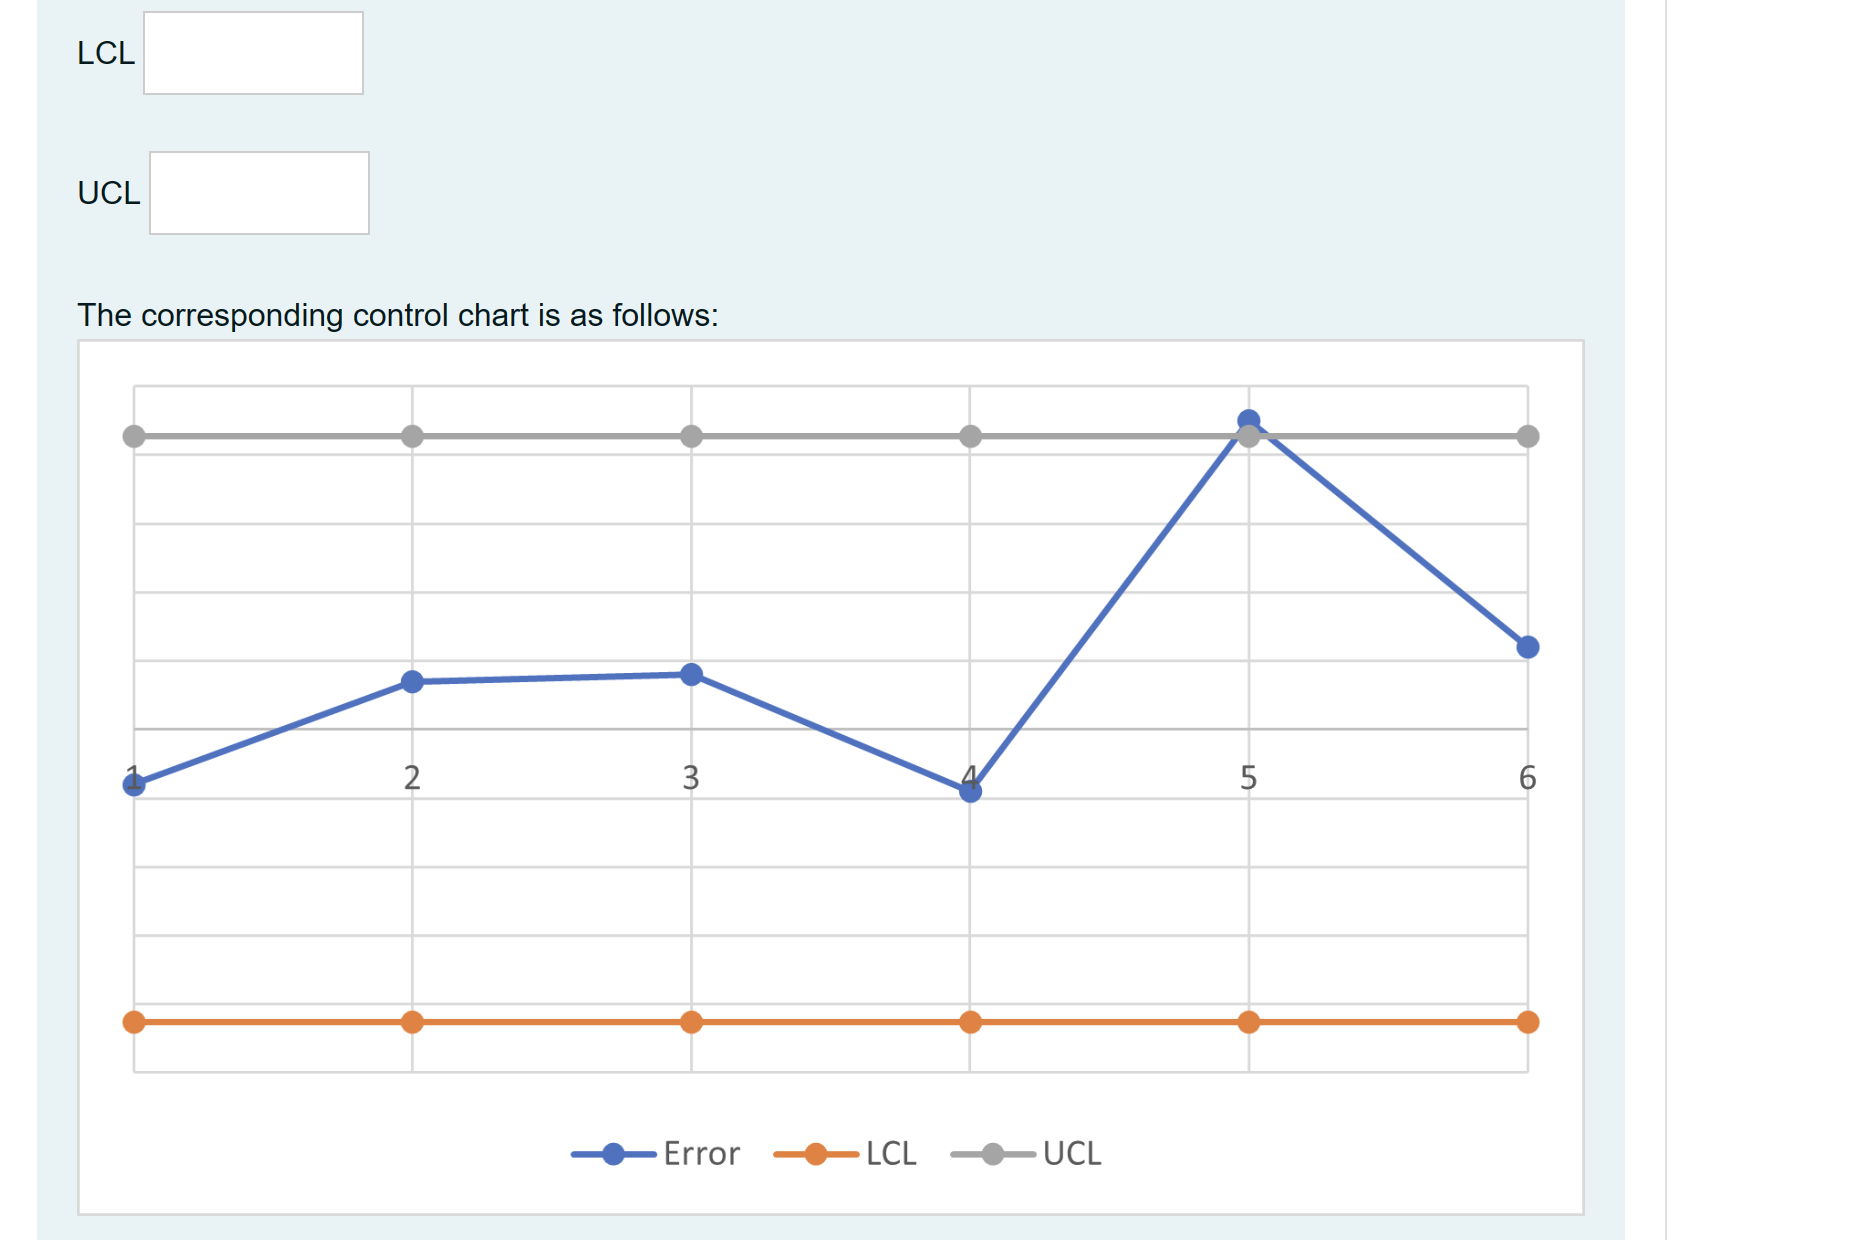
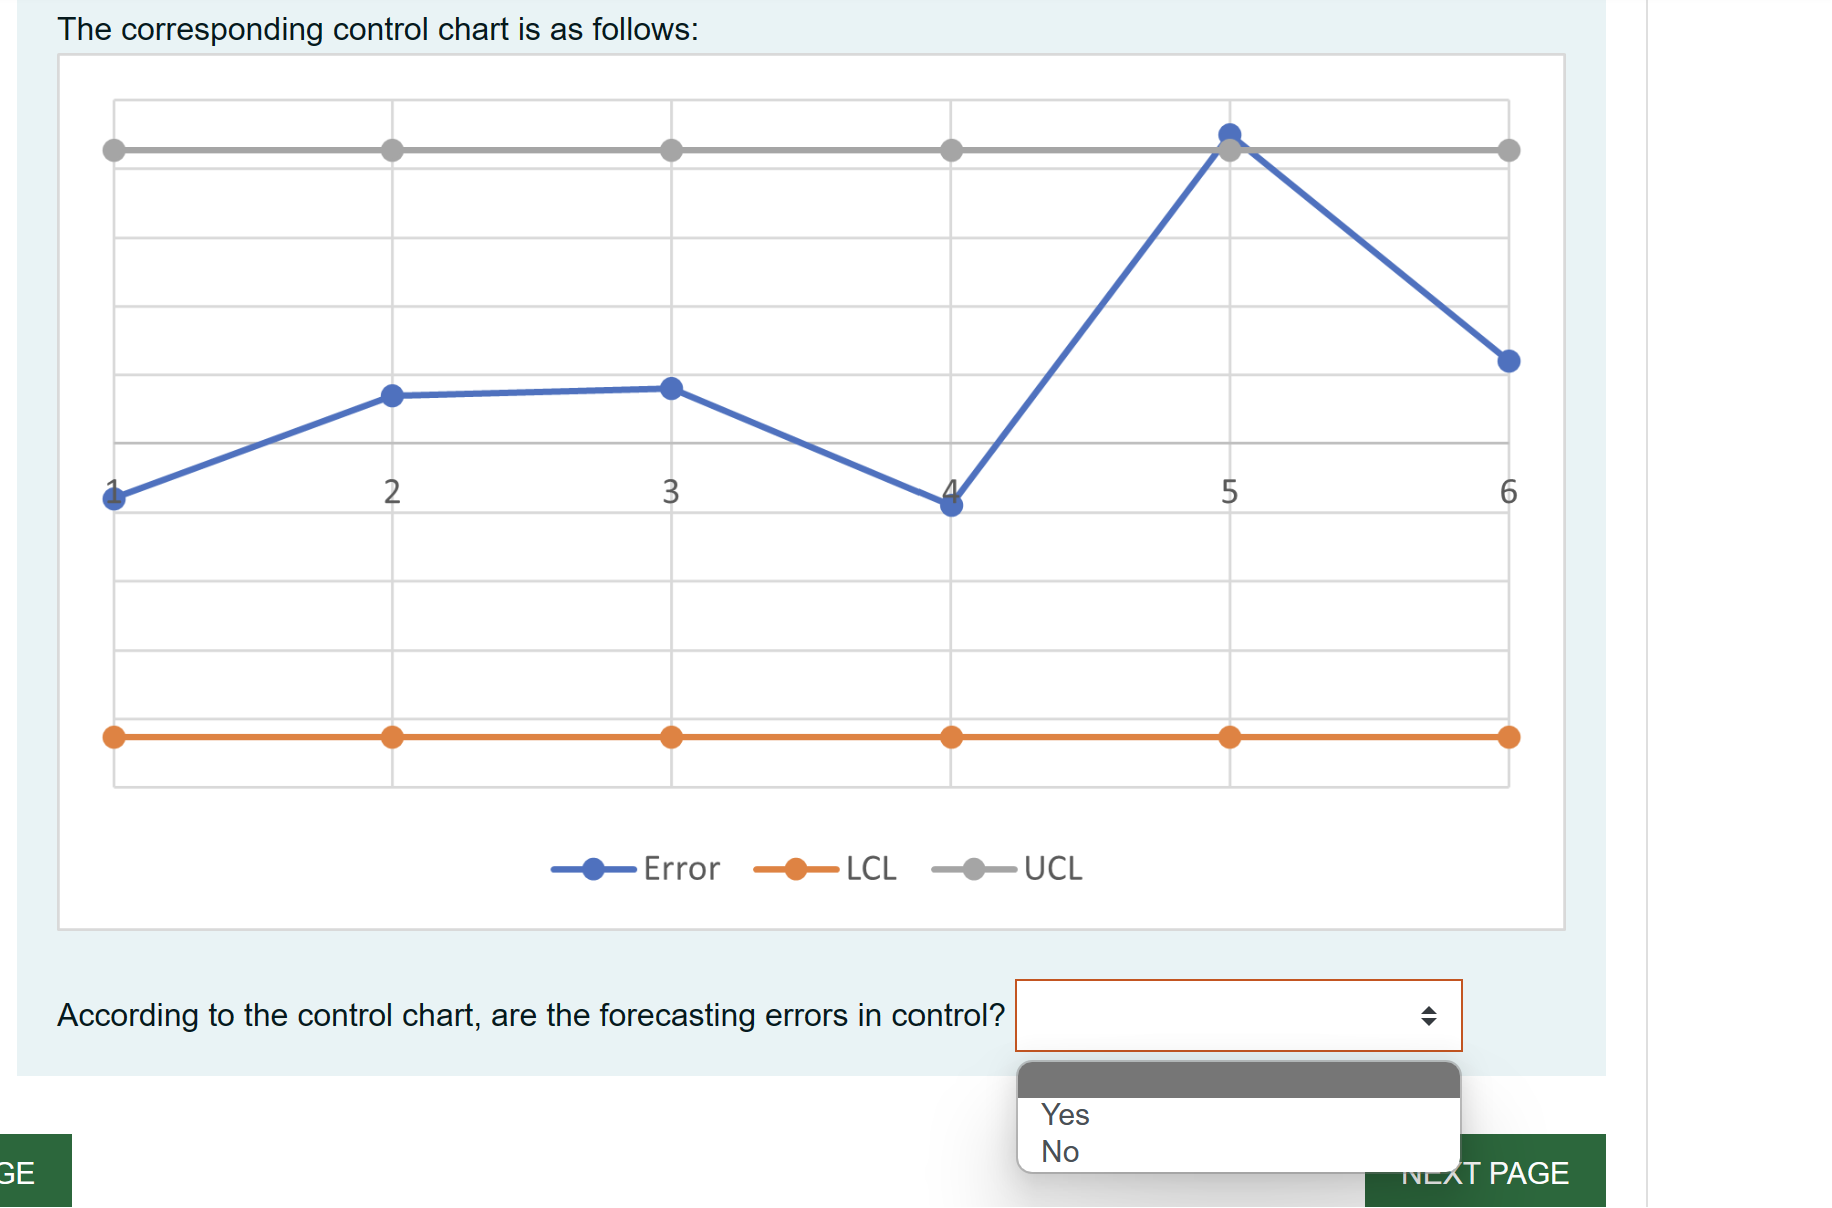
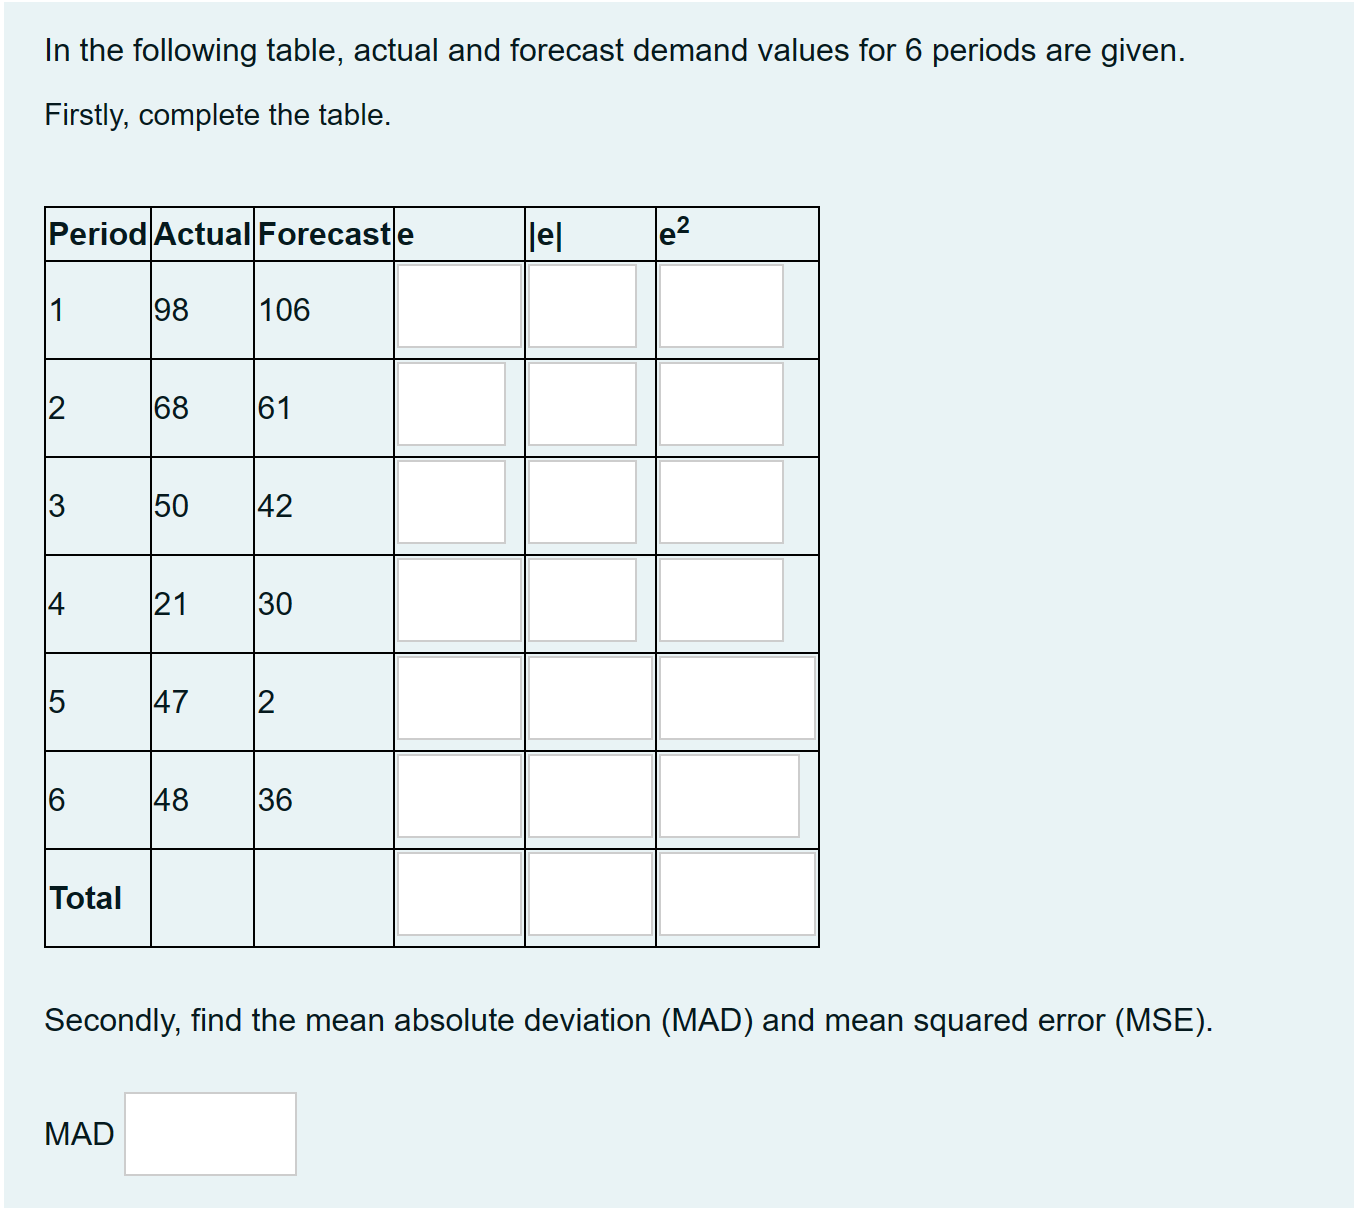 Secondly, find the mean absolute deviation (MAD) and mean squared error (MSE). MAD MSE Thirdly, find and analyze the tracking signal (TS). TS According to the TS, are the forecasting errors in control? Yes No Finally, find and analyze the upper (UCL) and lower (LCL) CUTTUI TITIS TUI Z - J. Z S LCLMSE Thirdly, find and analyze the tracking signal (TS). TS According to the TS, are the forecasting errors in control? Finally, find and analyze the upper (UCL) and lower (LCL) control limits for z = 3. N W N - LCL UCLLCL UCL The corresponding control chart is as follows: 2 3 5 6 Error LCL -UCLThe corresponding control chart is as follows: @Error 8LCL @UCL According to the control chart, are the forecasting errors in control? l:l e | o m In the following table, actual and forecast demand values for 6 periods are given. Firstly, complete the table. Period|Actual Forecast e Pk L e L il N I O Secondly, find the mean absolute deviation (MAD) and mean squared error (MSE). MAD
Step by Step Solution
There are 3 Steps involved in it

Get step-by-step solutions from verified subject matter experts