

Question: Section #02 # Major Grade Marks # Major Grade Marks 1 BAFB 80 B+ 85 B 21 22 GSCL 88 2 3 Degree Diploma Diploma
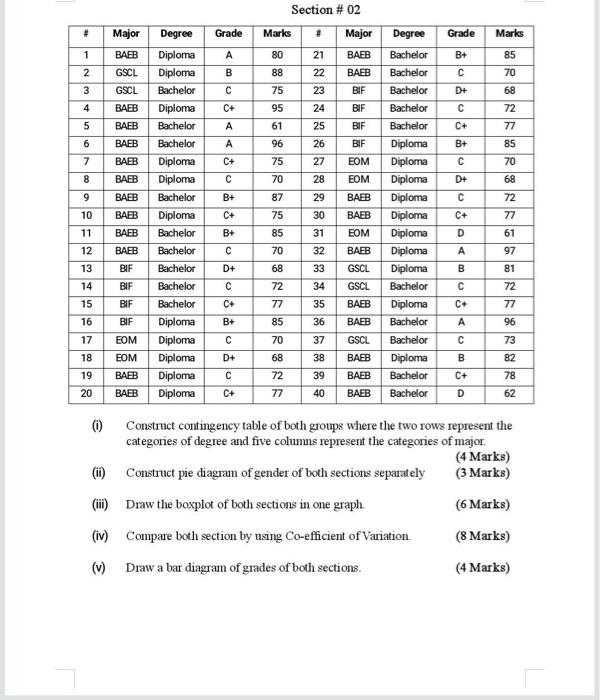
Section #02 # Major Grade Marks # Major Grade Marks 1 BAFB 80 B+ 85 B 21 22 GSCL 88 2 3 Degree Diploma Diploma Bachelor Diploma Bachelor BAEB BAEB BIF 70 68 GSCL 75 D+ 23 24 4 C+ 95 BIF 72 BAEB BAEB 5 BIF 77 A 61 96 25 26 C+ B+ BAEB Bachelor BIF 85 ON BAEB C+ 75 EOM 70 27 28 8 BAEB 70 EOM D+ 68 9 BAEB B+ BAEB C 72 87 75 10 BAEB C+ 77 61 Degree Bachelor Bachelor Bachelor Bachelor Bachelor Diploma Diploma Diploma Diploma Diploma Diploma Diploma Diploma Bachelor Diploma Bachelor Bachelor Diploma Bachelor Bachelor B+ 85 11 12 13 BAEB BAEB BIF 29 30 31 32 33 34 D 70 68 97 81 Diploma Diploma Bachelor Diploma Bachelor Bachelor Bachelor Bachelor Bachelor Diploma Diploma Diploma Diploma Diploma D+ B BAEB EOM BAEB GSCL GSCL BAEB BAEB GSCL 14 C 72 BIF BIF C+ C+ 15 16 77 85 35 36 72 77 96 BIF B+ 70 17 18 D+ BAEB B EOM EOM BAEB BAEB 68 72 37 38 39 40 73 82 78 19 BAEB C+ D 20 C+ 77 BAEB 62 0 (ii) Construct contingency table of both groups where the two rows represent the categories of degree and five columns represent the categories of major (4 Marks) Construct pie diagram of gender of both sections separately (3 Marks) Draw the boxplot of both sections in one graph. (6 Marks) Compare both section by using Co-efficient of Variation (8 Marks) Draw a bar diagram of grades of both sections. (4 Marks) (iv) Section #02 # Major Grade Marks # Major Grade Marks 1 BAFB 80 B+ 85 B 21 22 GSCL 88 2 3 Degree Diploma Diploma Bachelor Diploma Bachelor BAEB BAEB BIF 70 68 GSCL 75 D+ 23 24 4 C+ 95 BIF 72 BAEB BAEB 5 BIF 77 A 61 96 25 26 C+ B+ BAEB Bachelor BIF 85 ON BAEB C+ 75 EOM 70 27 28 8 BAEB 70 EOM D+ 68 9 BAEB B+ BAEB C 72 87 75 10 BAEB C+ 77 61 Degree Bachelor Bachelor Bachelor Bachelor Bachelor Diploma Diploma Diploma Diploma Diploma Diploma Diploma Diploma Bachelor Diploma Bachelor Bachelor Diploma Bachelor Bachelor B+ 85 11 12 13 BAEB BAEB BIF 29 30 31 32 33 34 D 70 68 97 81 Diploma Diploma Bachelor Diploma Bachelor Bachelor Bachelor Bachelor Bachelor Diploma Diploma Diploma Diploma Diploma D+ B BAEB EOM BAEB GSCL GSCL BAEB BAEB GSCL 14 C 72 BIF BIF C+ C+ 15 16 77 85 35 36 72 77 96 BIF B+ 70 17 18 D+ BAEB B EOM EOM BAEB BAEB 68 72 37 38 39 40 73 82 78 19 BAEB C+ D 20 C+ 77 BAEB 62 0 (ii) Construct contingency table of both groups where the two rows represent the categories of degree and five columns represent the categories of major (4 Marks) Construct pie diagram of gender of both sections separately (3 Marks) Draw the boxplot of both sections in one graph. (6 Marks) Compare both section by using Co-efficient of Variation (8 Marks) Draw a bar diagram of grades of both sections. (4 Marks) (iv)
Step by Step Solution
There are 3 Steps involved in it

Get step-by-step solutions from verified subject matter experts