

Question: Section 1- Construct (a) a scatter diagram for the supplied data concerning adjudicated delinquents. X is a family bonding scale (FB) ranging from 1 to
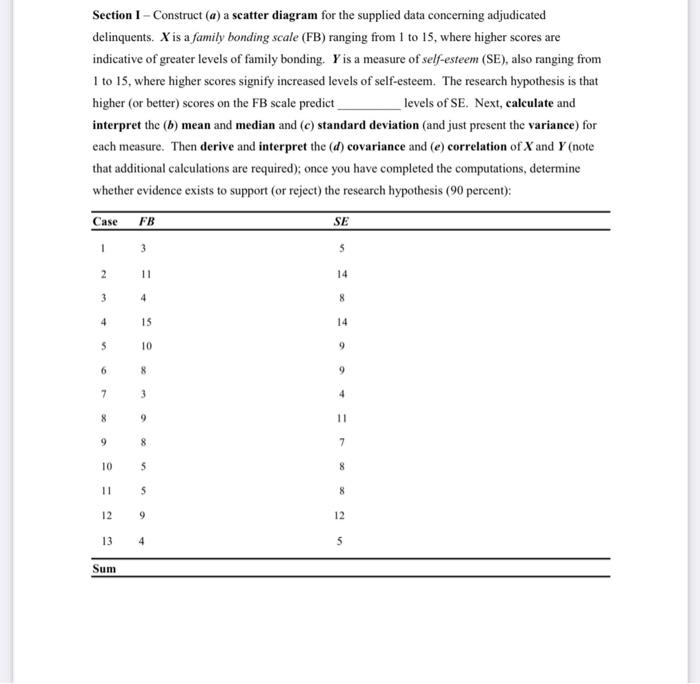
Section 1- Construct (a) a scatter diagram for the supplied data concerning adjudicated delinquents. X is a family bonding scale (FB) ranging from 1 to 15, where higher scores are indicative of greater levels of family bonding. Y is a measure of self-esteem (SE), also ranging from I to 15, where higher scores signify increased levels of self-esteem. The research hypothesis is that higher (or better) scores on the FB scale predict levels of SE. Next, calculate and interpret the (b) mean and median and (c) standard deviation (and just present the variance) for each measure. Then derive and interpret the (d) covariance and (e) correlation of X and Y (note that additional calculations are required); once you have completed the computations, determine whether evidence exists to support (or reject) the research hypothesis (90 percent): Case FB SE . 3 5 2 11 3 4 8 4 15 14 5 10 9 6 8 9 7 3 4 8 9 11 9 8 7 10 5 8 11 5 8 12 9 12 13 4 5 Sum
Step by Step Solution
There are 3 Steps involved in it

Get step-by-step solutions from verified subject matter experts