Question: Section 1 - Hands-on using Exe Total of 25 points and airline offices) Offices are distributed in different cities all over the countries. An Airline
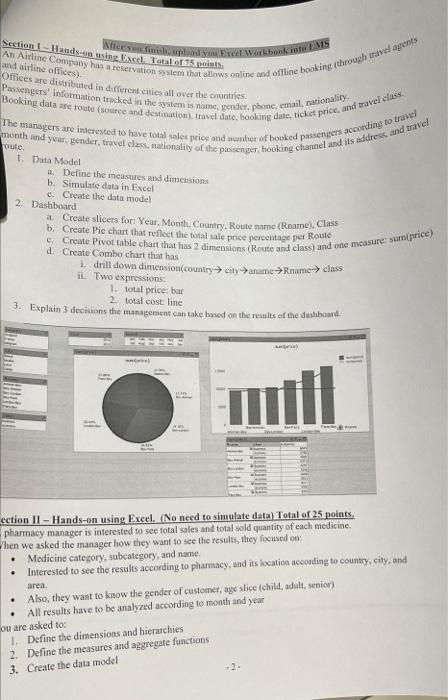
Section 1 - Hands-on using Exe Total of 25 points and airline offices) Offices are distributed in different cities all over the countries. An Airline Company has a reservation system that allows online and offline booking through relations Mer finishpad Excel Workbook into IMS Passengers Information tracked in the system is name, gender, phone, email, nationality. Booking data e route (source and destination), travel date, booking date, ticket price and travel class month and year, gender, travel class, nationality of the passenger booking channel and its address and travel The managers are interested to have total sales price and number of booked passengers according to travel route 1. Data Model a. Define the measures and dimensions b. Simulate data in Excel e. Create the data model 2. Dashboard a. Create slicers for: Year. Month, Country, Route name (Reame). Class b. Create Pie chart that reflect the total sale price percentage per Route d. Create Combo chart that has i drill down dimension country city-aname name class ii. Two expressions 1. total price: bar 2. total cost line 3. Explain 3 decisions the management can take based on the results of the dashboard. C. Create Pivot table chart that has 2 dimensions (Route and class and one measure sur price) area ection II - Hands-on using Excel. (No need to simulate data) Total of 25 points pharmacy manager is interested to see total sales and total sold quantity of each medicine, When we asked the manager how they want to see the results, they focused on Medicine category, subcategory, and name Interested to see the results according to pharmacy, and its location according to country, city, and Also, they want to know the gender of customer, age stice (child, adult senior) All results have to be analyzed according to month and year ou are asked to: 1. Define the dimensions and hierarchies 2. Define the measures and aggregate functions 3. Create the data model Section 1 - Hands-on using Exe Total of 25 points and airline offices) Offices are distributed in different cities all over the countries. An Airline Company has a reservation system that allows online and offline booking through relations Mer finishpad Excel Workbook into IMS Passengers Information tracked in the system is name, gender, phone, email, nationality. Booking data e route (source and destination), travel date, booking date, ticket price and travel class month and year, gender, travel class, nationality of the passenger booking channel and its address and travel The managers are interested to have total sales price and number of booked passengers according to travel route 1. Data Model a. Define the measures and dimensions b. Simulate data in Excel e. Create the data model 2. Dashboard a. Create slicers for: Year. Month, Country, Route name (Reame). Class b. Create Pie chart that reflect the total sale price percentage per Route d. Create Combo chart that has i drill down dimension country city-aname name class ii. Two expressions 1. total price: bar 2. total cost line 3. Explain 3 decisions the management can take based on the results of the dashboard. C. Create Pivot table chart that has 2 dimensions (Route and class and one measure sur price) area ection II - Hands-on using Excel. (No need to simulate data) Total of 25 points pharmacy manager is interested to see total sales and total sold quantity of each medicine, When we asked the manager how they want to see the results, they focused on Medicine category, subcategory, and name Interested to see the results according to pharmacy, and its location according to country, city, and Also, they want to know the gender of customer, age stice (child, adult senior) All results have to be analyzed according to month and year ou are asked to: 1. Define the dimensions and hierarchies 2. Define the measures and aggregate functions 3. Create the data model