

Question: Section 2.1 3. Use the data to create a stem plot. The attendance counts for this season's basketball games are listed below. 127, 139, 115,

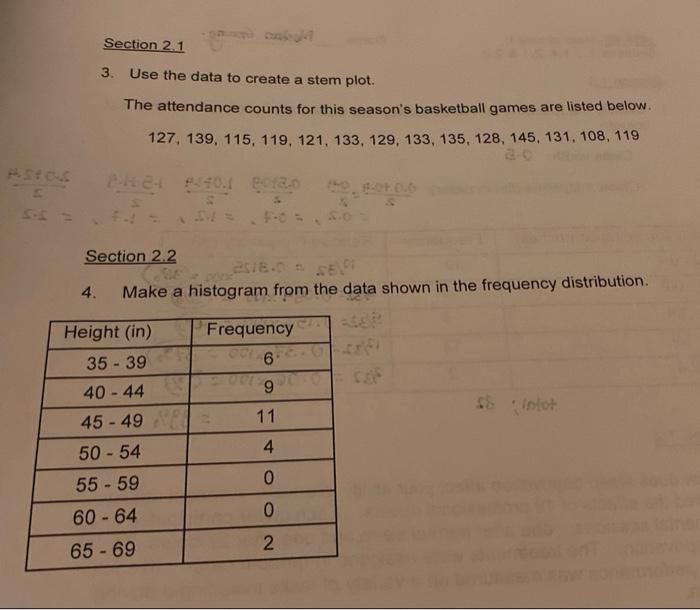
Section 2.1 3. Use the data to create a stem plot. The attendance counts for this season's basketball games are listed below. 127, 139, 115, 119, 121, 133, 129, 133, 135, 128, 145, 131, 108, 119 40. F.OHD.G Section 2.2 4. Make a histogram from the data shown in the frequency distribution. Height (in) Frequency 35 - 39 9 C.S 40 - 44 45 - 49 11 $8 . Inlot 50 - 54 4 55 - 59 0 60 - 64 0 65 - 69 2
Step by Step Solution
There are 3 Steps involved in it
1 Expert Approved Answer
Step: 1 Unlock

Question Has Been Solved by an Expert!
Get step-by-step solutions from verified subject matter experts
Step: 2 Unlock
Step: 3 Unlock