

Question: Section 2.2 Bar graphs and Circle Graphs (No HW) Representing Qualitative Data: Use a Bar Graph or Pie Chart WHAT KIND OF PET DO YOU
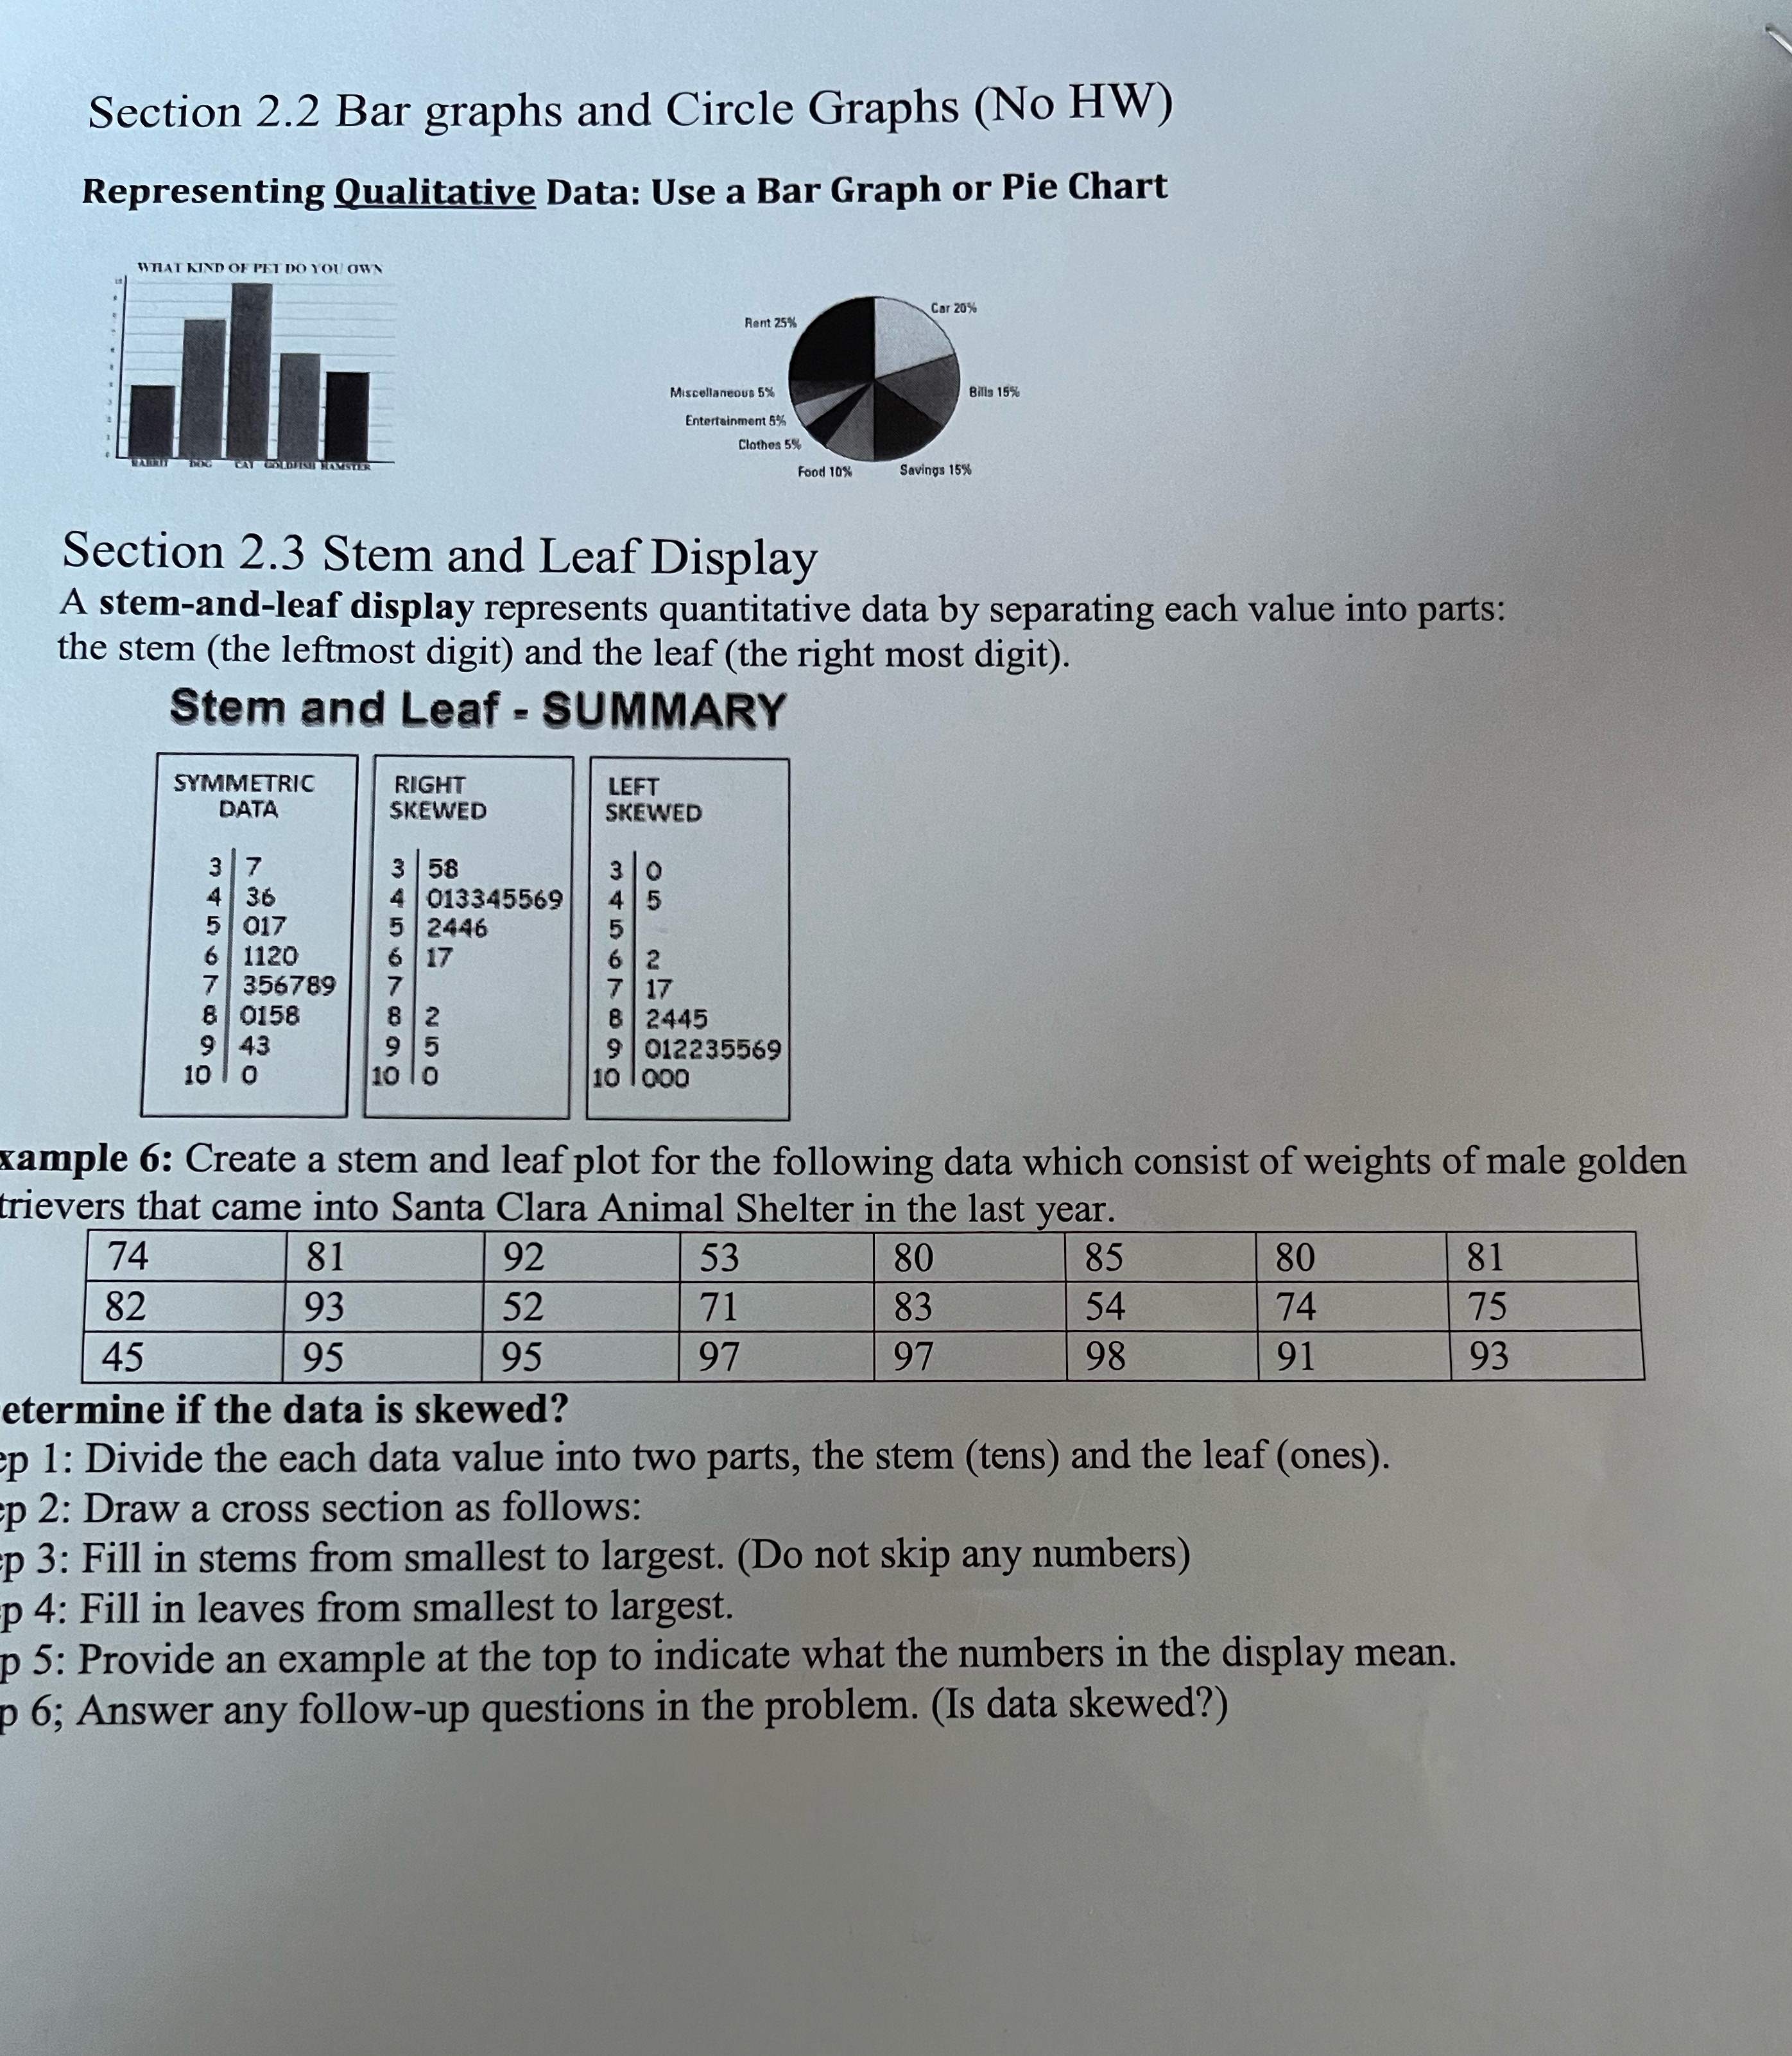

Section 2.2 Bar graphs and Circle Graphs (No HW) Representing Qualitative Data: Use a Bar Graph or Pie Chart WHAT KIND OF PET DO YOU OWN Car 20% Rent 25% Miscellaneous 5% Bills 15% Entertainment 5% Clothes 5% Food 10% Savings 15%% Section 2.3 Stem and Leaf Display A stem-and-leaf display represents quantitative data by separating each value into parts: the stem (the leftmost digit) and the leaf (the right most digit). Stem and Leaf - SUMMARY SYMMETRIC RIGHT LEFT DATA SKEWED SKEWED 3 3 1 58 4 013345569 5 017 5 2446 6 1120 6 17 2 7 356789 1 17 8 0158 2 8 2445 43 9 012235569 10 10 xample 6: Create a stem and leaf plot for the following data which consist of weights of male golden trievers that came into Santa Clara Animal Shelter in the last year. 74 81 92 53 80 85 80 81 82 93 52 71 83 54 74 75 45 95 95 97 97 98 91 93 etermine if the data is skewed? p 1: Divide the each data value into two parts, the stem (tens) and the leaf (ones). p 2: Draw a cross section as follows: p 3: Fill in stems from smallest to largest. (Do not skip any numbers) p 4: Fill in leaves from smallest to largest. p 5: Provide an example at the top to indicate what the numbers in the display mean. p 6; Answer any follow-up questions in the problem. (Is data skewed?)
Step by Step Solution
There are 3 Steps involved in it

Get step-by-step solutions from verified subject matter experts