

Question: Section 3 Data and study description: An experiment was set up to test the productivity of women against the productivity of men while performing
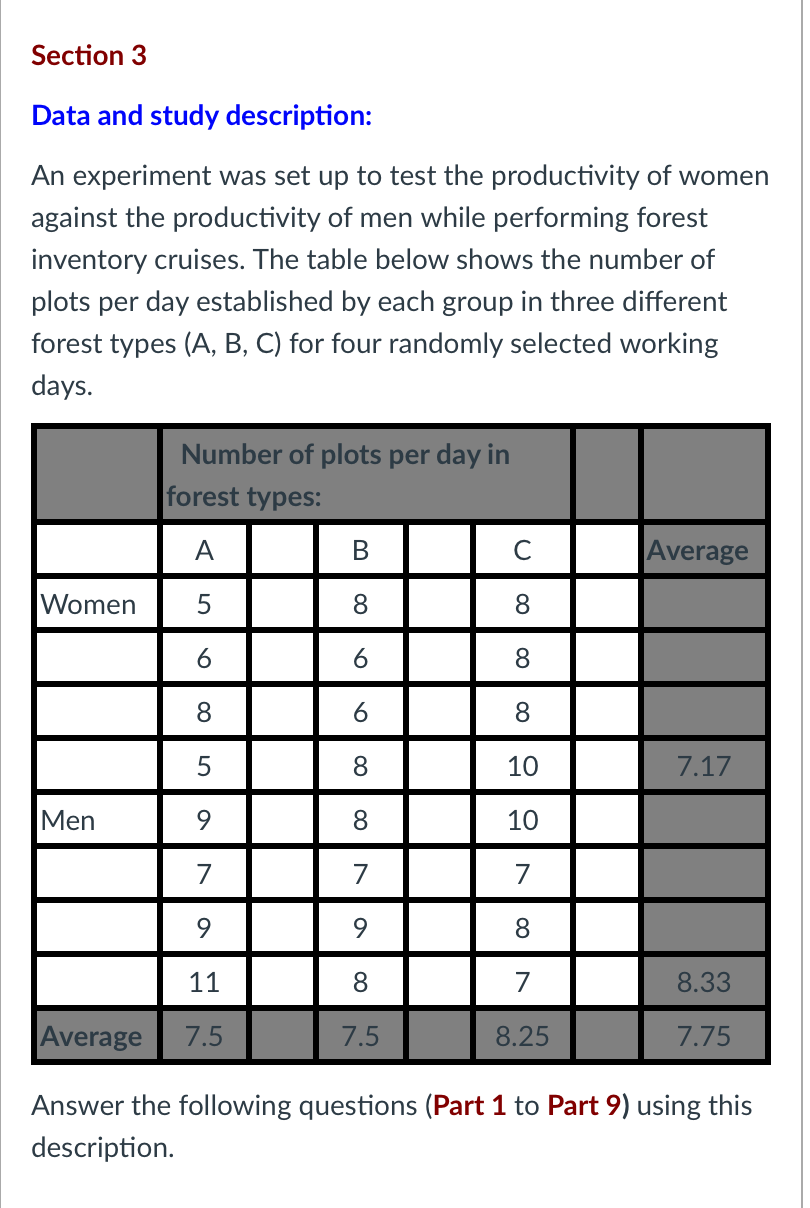
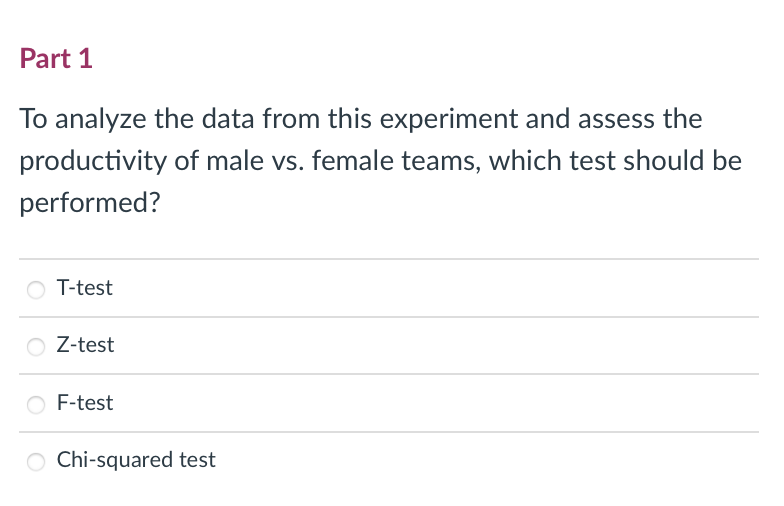
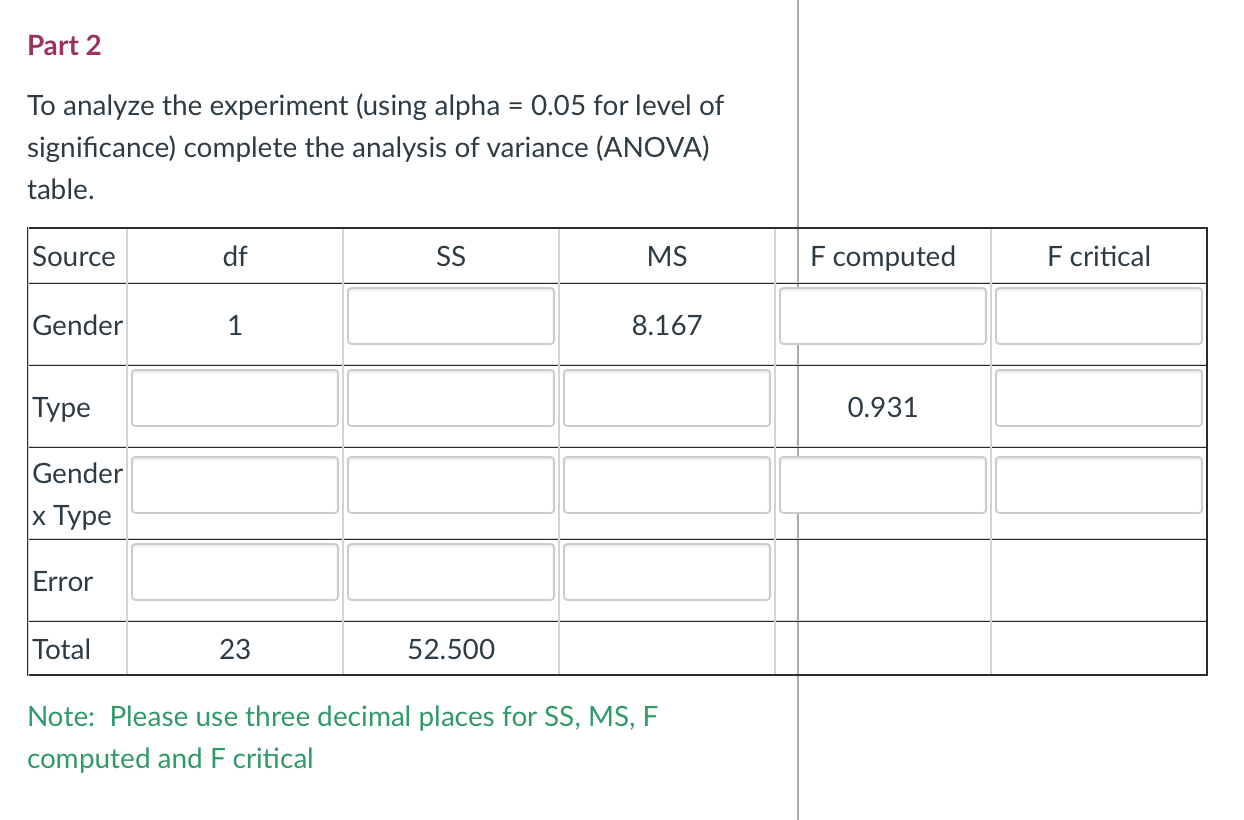
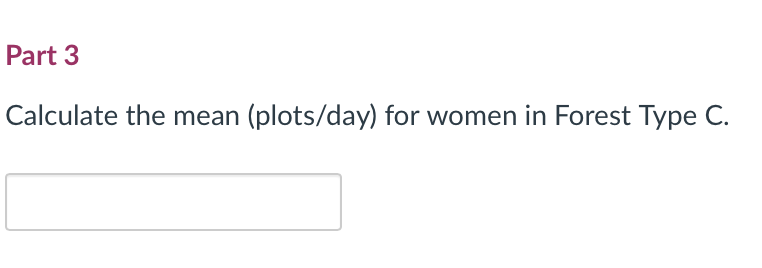
Section 3 Data and study description: An experiment was set up to test the productivity of women against the productivity of men while performing forest inventory cruises. The table below shows the number of plots per day established by each group in three different forest types (A, B, C) for four randomly selected working days. Number of plots per day in forest types: A B C Average Women 5 8 00 8 6 OO OO 16 8 8 6 8 Men 59 8 10 7.17 8 10 7 7 7 9 8 11 Average 7.5 15 8 00 7 8.33 7.5 8.25 7.75 Answer the following questions (Part 1 to Part 9) using this description. Part 1 To analyze the data from this experiment and assess the productivity of male vs. female teams, which test should be performed? T-test Z-test F-test O Chi-squared test Part 2 To analyze the experiment (using alpha = 0.05 for level of significance) complete the analysis of variance (ANOVA) table. Source df SS MS F computed F critical Gender 1 8.167 Type 0.931 Gender Type Error 23 Total 52.500 Note: Please use three decimal places for SS, MS, F computed and F critical Part 3 Calculate the mean (plots/day) for women in Forest Type C. Part 4 Find the standard error of the mean for women in Forest Type C. Part 5 To calculate the 95% confidence limits for the mean for women in Forest Type C, what critical value would you use?
Step by Step Solution
There are 3 Steps involved in it

Get step-by-step solutions from verified subject matter experts