Question: Section 3. Introduce the Dow Jones Industrial Average, NASDAQ Composite Index, S&P 500 Index, FTSE 100 Index, Nikkei 225 Index, and Stoxx Europe 600 Index,

Section 3. Introduce the Dow Jones Industrial Average, NASDAQ Composite Index, S&P 500 Index, FTSE 100 Index, Nikkei 225 Index, and Stoxx Europe 600 Index, respectively. From "Historical Data" on Yahoo Finance (p.6), download (copy+paste) monthly (CLOSE) prices of the Dow Jones Industrial Average (^DJI), NASDAQ Composite Index (^IXIC), and S&P 500 Index (^GSPC), respectively, over the period 1/1/2013- 1/2/2023 (start date-end date). After downloading the data, sort the data in an ascending order by date. The first observation should be on January 1, 2013 and the last observation should be on January 1, 2023, respectively. Total = 121 monthly prices. For each index, copy the Date and Close (price) columns to another sheet. Align the prices of 3 indices by date. Calculate the monthly return (% price change) for each index. # of observations = 120 monthly returns (LOSE one observation on top). Use 120 monthly returns (= N = sample size) to do statistical analysis (You learned from BUS 2810 Business Statistics I; put all results on one Excel sheet): (1) Calculate the summary statistics of each index, (2) get the histogram (chart) of each index, (3) calculate the correlation coefficients between 3 pairs of indices, and (4) perform other statistical analysis. Discuss statistical results.
 Section 3. Introduce the Dow Jones Industrial Average, NASDAQ Composite Index,

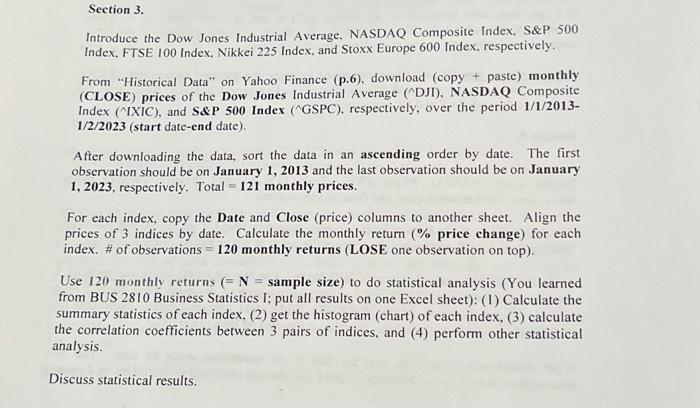
Introduce the Dow Jones Industrial Average, NASDAQ Composite Index, S\&P 500 Index, FTSE 100 Index. Nikkei 225 Index, and Stoxx Europe 600 Index, respectively. From "Historical Data" on Yahoo Finance (p.6), download (copy + paste) monthly (CLOSE) prices of the Dow Jones Industrial Average ( DJI), NASDAQ Composite Index ( IXIC), and S\&P 500 Index ( GSPC), respectively, over the period 1/1/20131/2/2023 (start date-end date). After downloading the data, sort the data in an ascending order by date. The first observation should be on January 1, 2013 and the last observation should be on January 1,2023 , respectively. Total =121 monthly prices. For each index, copy the Date and Close (price) columns to another sheet. Align the prices of 3 indices by date. Calculate the monthly return (\% price change) for each index. \# of observations =120 monthly returns (LOSE one observation on top). Use 120 monthly returns ( =N= sample size) to do statistical analysis (You learned from BUS 2810 Business Statistics I; put all results on one Excel sheet): (1) Calculate the summary statistics of each index. (2) get the histogram (chart) of each index, (3) calculate he correlation coefficients between 3 pairs of indices, and (4) perform other statistical nalysis

Step by Step Solution

There are 3 Steps involved in it

1 Expert Approved Answer
Step: 1 Unlock blur-text-image
Question Has Been Solved by an Expert!

Get step-by-step solutions from verified subject matter experts

Step: 2 Unlock
Step: 3 Unlock

Students Have Also Explored These Related Finance Questions!