

Question: - Section 3 - Ratio Analysis For the most current year in this section you must: Provide a link to the most-recent 10K used Display
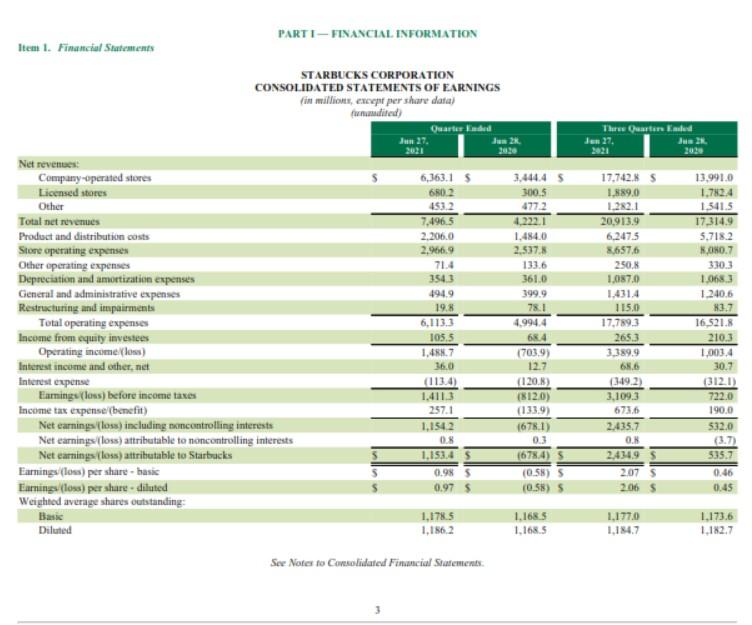
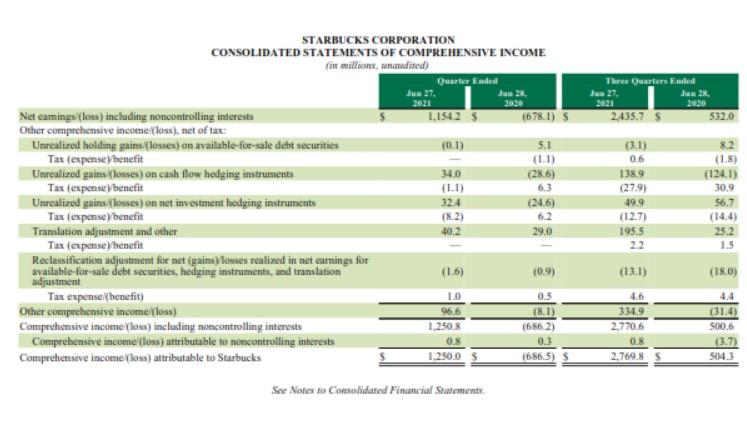
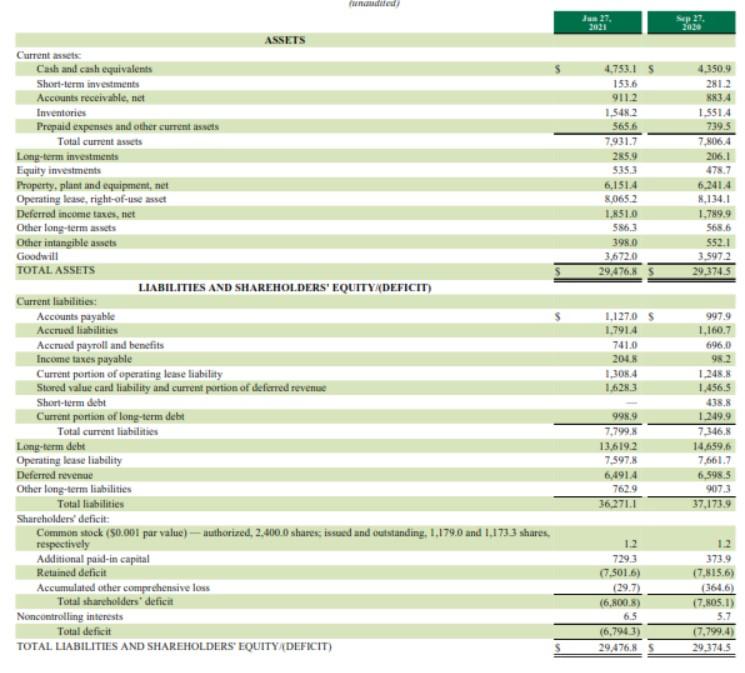
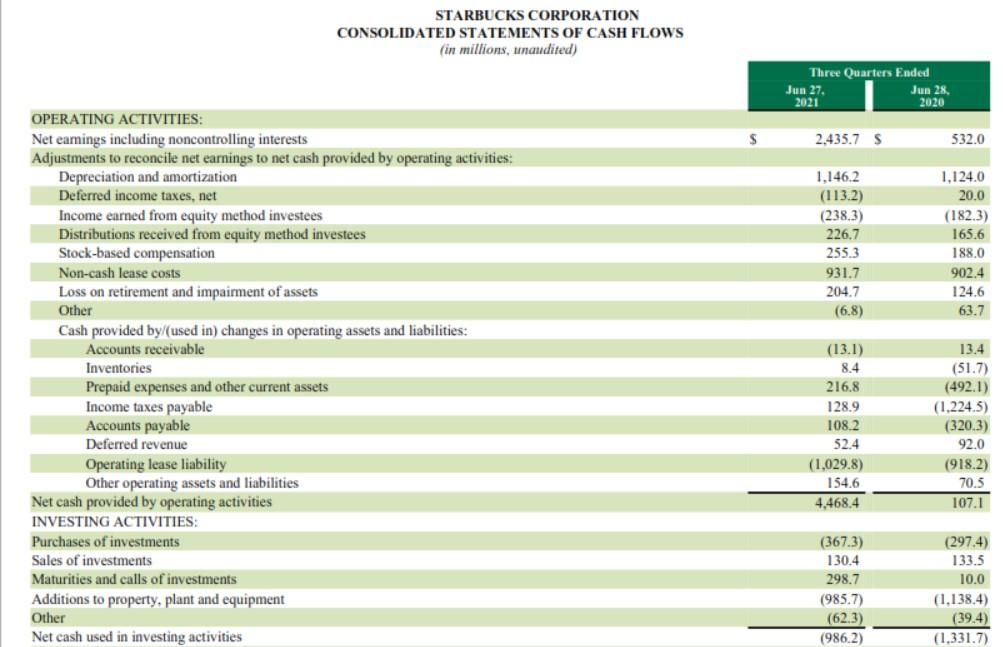
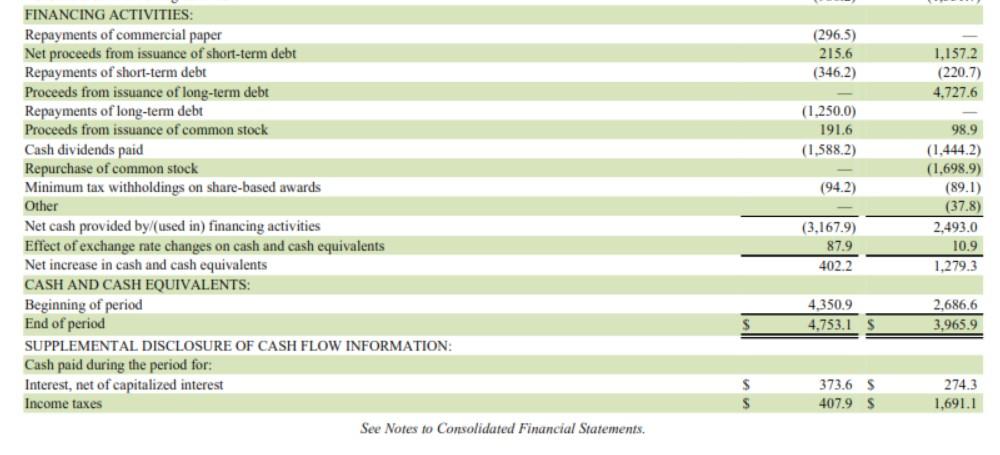
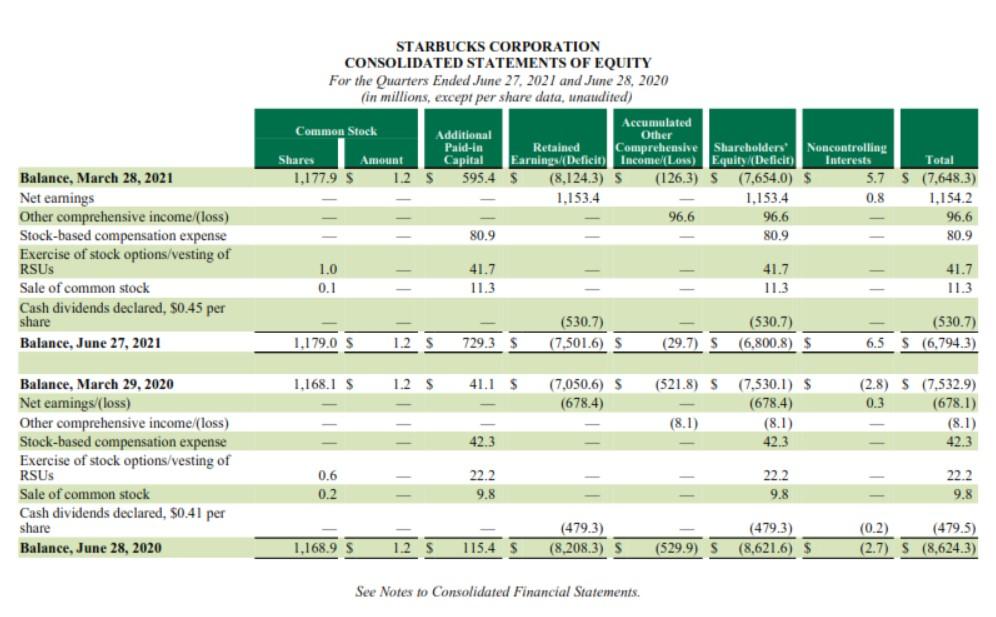
- Section 3 - Ratio Analysis For the most current year in this section you must: Provide a link to the most-recent 10K used Display the Ratio Name & Formula Show how you calculated the ratio. If ratio use averages be sure to show how you got the averages. Explain where you obtained the numbers you used in the calculation (e.g. Current Assets was obtained from the Balance Sheet) - give page numbers from the 10K Interpret the Ratio results. You may need to compare to industry or competitors to support your claim. Calculate the following: (Note: some might not apply to your company such as Dividend Yield if your company does not pay dividends) 1. Current Ratio 2. Acid Test Ratio 3. Accounts Receivable Turnover 4. Inventory Turnover 5. Days' Sales Uncollected 6. Debt Ratio 7. Times Interest Earned 8. Profit Margin Ratio 9. Return on Total Assets 10. Return on Equity 11. Earnings Per Share Three Quarter Kaled den 27. Jua 2 202 PARTI-FINANCIAL INFORMATION Item 1. Financial Statements STARBUCKS CORPORATION CONSOLIDATED STATEMENTS OF EARNINGS fin millions, except per share data) dited) Owarterded Jun 27. Jun 2. 2021 Net revettes Company-operated stores 6,363.1 3.4444 S Licensed stores 680.2 300.5 Other 453.2 4772 Total net revenues 7.496.5 4.222.1 Product and distribution costs 2.206.0 1.484.0 Store operating expenses 2,966,9 2,537.3 Other operating expenses 71.4 133.6 Depreciation and amortization expenses 3543 361.0 General and administrative expenses 494.9 399.9 Restructuring and impairments 19. 781 Total operating expenses 6,113.3 4.9944 Income from equity investees 105.5 68.4 Operating incomeless) 1.4.7 (7039) Interest income and other net 36.0 12.7 Interest expense (1134) (120.8) Faringsfoss) before income taxes 1.4113 (8120) Income tax expense(benefit) 257.1 (133.9) Net earnings (los) including noncontrolling interests 1,1542 (6781) Net earningsloss) attributable to noncontrolling interests OS 0.3 Net earnings (less) attributable to Starbucks 1,153.45 1678.4) 5 Earnings (lows) per share-hasie 0.985 (055) 5 Earnings (los) per share-diluted 0.97 (0.58) Weighted average shares outstanding Basic 1,178,5 1.168.5 Diluted 1,186,2 1.168.5 17,742.85 1,889,0 1282.1 20,913.9 6.247.5 8,657,6 250, 1,087.0 1.431.4 115.0 17,789.3 2653 3.389.9 68.6 (349.2) 3.109.3 673.6 2,435.7 ON 2.4349 207 S 206 s 13.991.0 1.7824 1.541.5 17.314.9 5.7182 K.OHO.7 3303 1.0683 1.240.6 13.7 16.521.8 210.3 1.003.4 30.7 (3121) 722.0 190.0 532.0 (3.7) 535.7 0.46 0.45 1,177,0 1,184.7 1.173.6 1,182.7 See Notes to Consolidated Financial Statements STARBUCKS CORPORATION CONSOLIDATED STATEMENTS OF COMPREHENSIVE INCOME fan million, mended) Quarter med 2021 Three Quartiers Ended Jun 27. Jus 2 2021 2,435.75 532.0 1,15425 (678.1) 5 (0.1) 14.0 (11) 12.4 (8.2) 5.1 (1.1) (286) 63 (246) 6.2 29.0 Net camings/loss) including noncontrolling interests Other comprehensive income (los), net of tax Unrealized holding gains losses) on available-for-sale debt securities Tax (expense benefit Unrealized gains Klosses) on cash flow hedging instruments Tax (expense benefit Uncalired gains (Roses) on net investment hedging instruments Tas (expose) benefit Translation adjustment and other Tax (expense benefit Reclassification adjustment for net(gain losses realized in net earnings for available for sale de securities, hedging instruments, and translation adjustment Tex expense benefit) Other comprehensive income (los) Comprehensive income (los) including nacontrolling interests Comprehensive income (loss) attributable to noncontrolling interests Comprehensive income (los) attributable to Starbucks (3.1) 0.6 138.9 (27.9) 49.9 (12.7) 1955 22 8.2 (1.8) (124.1) 30.9 56.7 (14.4) 25.2 1.5 10.2 (16) (0.9) (180) 10 96.6 1.250,8 OS 1.250.05 05 (8.1) 16562) 03 1686.5) 5 4.6 3349 2.770.6 0.8 2,769.8 4.4 (31.4) 500.5 (3.71 504.3 See Notes to Consolidated Financial Statements, 2030 ASSETS 4.753.15 153,6 9112 1.548.2 565.6 7,931.7 285.9 5353 6,151.4 8.065.2 1.851.0 586.3 398.0 3,672.0 29,476.85 4.350.9 281.2 883A 1.5514 739.5 7,8064 206.1 478.7 6.241.4 8.134.1 1.789.9 5686 552.1 3.5972 29,374.5 Current assets Cash and cash equivalents Short-term investments Accounts receivable, net Inventories Prepaid expenses and other current assets Total current assets Long-term investments Equity investments Property, plant and equipment, met Operating lease, right-of-use asset Deferred income taxes, net Other long-term assets Other intangible assets Goodwill TOTAL ASSETS LIABILITIES AND SHAREHOLDERS' EQUITY/DEFICIT) Current liabilities: Accounts payable Accrued liabilities Accrued payroll and benefits Income taxes payable Current portion of sperating lease liability Stored value and liability and current portion of deferred revenue Short-term debt Current portion of long-term debt Total current liabilities Long-term debt Operating lease liability Deferred revenue Other long-term liabilities Total liabilities Shareholders' deficit: Common stock (50.001 par value) - authorized, 2.000.0 shares, issued and outstanding, 1.179.0 and 1.173.3 shares respectively Additional puid-in capital Retained delicit Accumulated other comprehensive loss Total shareholders' deficit Noncontrolling interests Total deficit TOTAL LIABILITIES AND SHAREHOLDERS' EQUITY DEFICIT 1.127,0 s 1.7914 741.0 204 1,308.4 1.6283 99.9 7.799. 13,619.2 7.597.8 6,491.4 762.9 36.2711 997.9 1.160.7 696,0 982 1.2458 1.456.5 438.8 1.249.9 7.346,8 14.659.6 7,661.7 6,598 5 907.3 37,173.9 12 7293 (1.501.6) (29.7) (6,800.8) 1.2 373.9 (7.815.6) (3646) (7.805.1) 5.7 (7,799.4) 29.374.5 65 (6,7943) 29,476,8 S STARBUCKS CORPORATION CONSOLIDATED STATEMENTS OF CASH FLOWS (in millions, unaudited) Three Quarters Ended Jun 27 Jun 28, 2021 2020 S 2.435.7 S 532.0 1.146.2 (113.2) (238.3) 226,7 255.3 931.7 204.7 (6.8) 1.124.0 20.0 (182.3) 165.6 188.0 902.4 124.6 63.7 OPERATING ACTIVITIES: Net eamings including noncontrolling interests Adjustments to reconcile net earnings to net cash provided by operating activities: Depreciation and amortization Deferred income taxes, net Income earned from equity method investees Distributions received from equity method investees Stock-based compensation Non-cash lease costs Loss on retirement and impairment of assets Other Cash provided by used in) changes in operating assets and liabilities: Accounts receivable Inventories Prepaid expenses and other current assets Income taxes payable Accounts payable Deferred revenue Operating lease liability Other operating assets and liabilities Net cash provided by operating activities INVESTING ACTIVITIES: Purchases of investments Sales of investments Maturities and calls of investments Additions to property, plant and equipment Other Net cash used in investing activities (13.1) 8.4 216.8 128.9 108.2 52.4 (1.029.8) 154.6 4,468.4 13.4 (51.7) (492.1) (1,224.5) (320.3) 92.0 (918.2) 70.5 107.1 (367.3) 130.4 298.7 (985.7) (62.3) (986.2) (297.4) 133.5 10.0 (1.138.4) (39.4) (1.331.7) (296.5) 215.6 (346.2) 1,1572 (220.7) 4.727.6 (1,250.0) 1916 (1,588.2) (94.2) FINANCING ACTIVITIES: Repayments of commercial paper Net proceeds from issuance of short-term debt Repayments of short-term debt Proceeds from issuance of long-term debt Repayments of long-term debt Proceeds from issuance of common stock Cash dividends paid Repurchase of common stock Minimum tax withholdings on share-based awards Other Net cash provided by used in) financing activities Effect of exchange rate changes on cash and cash equivalents Net increase in cash and cash equivalents CASH AND CASH EQUIVALENTS: Beginning of period End of period SUPPLEMENTAL DISCLOSURE OF CASH FLOW INFORMATION: Cash paid during the period for: Interest, net of capitalized interest Income taxes See Notes to Consolidated Financial Statements. 98.9 (1,444.2) (1.698.9) (89.1) (37.8) 2,493.0 10.9 1,279.3 (3,167.9) 879 402.2 4,350.9 4.753.1 2.686.6 3,965.9 373.6 $ 407.9 $ 274.3 1,691.1 S STARBUCKS CORPORATION CONSOLIDATED STATEMENTS OF EQUITY For the Quarters Ended June 27, 2021 and June 28, 2020 (in millions, except per share data, unaudited) Accumulated Common Stock Additional Other Paid in Retained Comprehensive Shareholders Noncontrolling Amount Capital Earnings/Deficio Income/Loss) Equity (Deficit Interests Total 1,177.9 $ 1.2 $ 595.4 5 (8,124.3) S (126.3) S (7,654.0) $ 5.7 S (7,648.3) 1.153.4 1,153.4 0.8 1.154.2 96,6 96.6 80.9 80.9 80.9 Shares 96.6 Balance, March 28, 2021 Net earings Other comprehensive income (loss) Stock-based compensation expense Exercise of stock options/vesting of RSUS Sale of common stock Cash dividends declared, $0.45 per share Balance, June 27, 2021 LO 0.1 41.7 11.3 41.7 11.3 41.7 11.3 (530.7) (7,501.6) 5 (530.7) (6.800.8) $ (530.7) S (6,794.3) 1.179.0 S 1.2 S 729.3 $ (29.7) S 6.5 1.168.1 S 1.2 S 41.1 $ (521.8) S (7,050.6) S (678.4) (7.530.1) S (678.4) (8.1) 42.3 (2.8) S (7.532.9) 0.3 (678.1) (8.1) 42.3 (8.1) 42.3 Balance, March 29, 2020 Net eamings/(loss) Other comprehensive income (loss) Stock-based compensation expense Exercise of stock options/vesting of RSUS Sale of common stock Cash dividends declared, $0.41 per share Balance, June 28, 2020 0.6 0.2 22.2 9.8 22.2 9.8 22.2 9.8 (479.3) (8,208.3) (4793) (8,621.6) (0.2) (479.5) (2.7) S (8,624.3) 1.168.9 S 1.2 115.4 (529.9) 5 See Notes to Consolidated Financial Statements. - Section 3 - Ratio Analysis For the most current year in this section you must: Provide a link to the most-recent 10K used Display the Ratio Name & Formula Show how you calculated the ratio. If ratio use averages be sure to show how you got the averages. Explain where you obtained the numbers you used in the calculation (e.g. Current Assets was obtained from the Balance Sheet) - give page numbers from the 10K Interpret the Ratio results. You may need to compare to industry or competitors to support your claim. Calculate the following: (Note: some might not apply to your company such as Dividend Yield if your company does not pay dividends) 1. Current Ratio 2. Acid Test Ratio 3. Accounts Receivable Turnover 4. Inventory Turnover 5. Days' Sales Uncollected 6. Debt Ratio 7. Times Interest Earned 8. Profit Margin Ratio 9. Return on Total Assets 10. Return on Equity 11. Earnings Per Share Three Quarter Kaled den 27. Jua 2 202 PARTI-FINANCIAL INFORMATION Item 1. Financial Statements STARBUCKS CORPORATION CONSOLIDATED STATEMENTS OF EARNINGS fin millions, except per share data) dited) Owarterded Jun 27. Jun 2. 2021 Net revettes Company-operated stores 6,363.1 3.4444 S Licensed stores 680.2 300.5 Other 453.2 4772 Total net revenues 7.496.5 4.222.1 Product and distribution costs 2.206.0 1.484.0 Store operating expenses 2,966,9 2,537.3 Other operating expenses 71.4 133.6 Depreciation and amortization expenses 3543 361.0 General and administrative expenses 494.9 399.9 Restructuring and impairments 19. 781 Total operating expenses 6,113.3 4.9944 Income from equity investees 105.5 68.4 Operating incomeless) 1.4.7 (7039) Interest income and other net 36.0 12.7 Interest expense (1134) (120.8) Faringsfoss) before income taxes 1.4113 (8120) Income tax expense(benefit) 257.1 (133.9) Net earnings (los) including noncontrolling interests 1,1542 (6781) Net earningsloss) attributable to noncontrolling interests OS 0.3 Net earnings (less) attributable to Starbucks 1,153.45 1678.4) 5 Earnings (lows) per share-hasie 0.985 (055) 5 Earnings (los) per share-diluted 0.97 (0.58) Weighted average shares outstanding Basic 1,178,5 1.168.5 Diluted 1,186,2 1.168.5 17,742.85 1,889,0 1282.1 20,913.9 6.247.5 8,657,6 250, 1,087.0 1.431.4 115.0 17,789.3 2653 3.389.9 68.6 (349.2) 3.109.3 673.6 2,435.7 ON 2.4349 207 S 206 s 13.991.0 1.7824 1.541.5 17.314.9 5.7182 K.OHO.7 3303 1.0683 1.240.6 13.7 16.521.8 210.3 1.003.4 30.7 (3121) 722.0 190.0 532.0 (3.7) 535.7 0.46 0.45 1,177,0 1,184.7 1.173.6 1,182.7 See Notes to Consolidated Financial Statements STARBUCKS CORPORATION CONSOLIDATED STATEMENTS OF COMPREHENSIVE INCOME fan million, mended) Quarter med 2021 Three Quartiers Ended Jun 27. Jus 2 2021 2,435.75 532.0 1,15425 (678.1) 5 (0.1) 14.0 (11) 12.4 (8.2) 5.1 (1.1) (286) 63 (246) 6.2 29.0 Net camings/loss) including noncontrolling interests Other comprehensive income (los), net of tax Unrealized holding gains losses) on available-for-sale debt securities Tax (expense benefit Unrealized gains Klosses) on cash flow hedging instruments Tax (expense benefit Uncalired gains (Roses) on net investment hedging instruments Tas (expose) benefit Translation adjustment and other Tax (expense benefit Reclassification adjustment for net(gain losses realized in net earnings for available for sale de securities, hedging instruments, and translation adjustment Tex expense benefit) Other comprehensive income (los) Comprehensive income (los) including nacontrolling interests Comprehensive income (loss) attributable to noncontrolling interests Comprehensive income (los) attributable to Starbucks (3.1) 0.6 138.9 (27.9) 49.9 (12.7) 1955 22 8.2 (1.8) (124.1) 30.9 56.7 (14.4) 25.2 1.5 10.2 (16) (0.9) (180) 10 96.6 1.250,8 OS 1.250.05 05 (8.1) 16562) 03 1686.5) 5 4.6 3349 2.770.6 0.8 2,769.8 4.4 (31.4) 500.5 (3.71 504.3 See Notes to Consolidated Financial Statements, 2030 ASSETS 4.753.15 153,6 9112 1.548.2 565.6 7,931.7 285.9 5353 6,151.4 8.065.2 1.851.0 586.3 398.0 3,672.0 29,476.85 4.350.9 281.2 883A 1.5514 739.5 7,8064 206.1 478.7 6.241.4 8.134.1 1.789.9 5686 552.1 3.5972 29,374.5 Current assets Cash and cash equivalents Short-term investments Accounts receivable, net Inventories Prepaid expenses and other current assets Total current assets Long-term investments Equity investments Property, plant and equipment, met Operating lease, right-of-use asset Deferred income taxes, net Other long-term assets Other intangible assets Goodwill TOTAL ASSETS LIABILITIES AND SHAREHOLDERS' EQUITY/DEFICIT) Current liabilities: Accounts payable Accrued liabilities Accrued payroll and benefits Income taxes payable Current portion of sperating lease liability Stored value and liability and current portion of deferred revenue Short-term debt Current portion of long-term debt Total current liabilities Long-term debt Operating lease liability Deferred revenue Other long-term liabilities Total liabilities Shareholders' deficit: Common stock (50.001 par value) - authorized, 2.000.0 shares, issued and outstanding, 1.179.0 and 1.173.3 shares respectively Additional puid-in capital Retained delicit Accumulated other comprehensive loss Total shareholders' deficit Noncontrolling interests Total deficit TOTAL LIABILITIES AND SHAREHOLDERS' EQUITY DEFICIT 1.127,0 s 1.7914 741.0 204 1,308.4 1.6283 99.9 7.799. 13,619.2 7.597.8 6,491.4 762.9 36.2711 997.9 1.160.7 696,0 982 1.2458 1.456.5 438.8 1.249.9 7.346,8 14.659.6 7,661.7 6,598 5 907.3 37,173.9 12 7293 (1.501.6) (29.7) (6,800.8) 1.2 373.9 (7.815.6) (3646) (7.805.1) 5.7 (7,799.4) 29.374.5 65 (6,7943) 29,476,8 S STARBUCKS CORPORATION CONSOLIDATED STATEMENTS OF CASH FLOWS (in millions, unaudited) Three Quarters Ended Jun 27 Jun 28, 2021 2020 S 2.435.7 S 532.0 1.146.2 (113.2) (238.3) 226,7 255.3 931.7 204.7 (6.8) 1.124.0 20.0 (182.3) 165.6 188.0 902.4 124.6 63.7 OPERATING ACTIVITIES: Net eamings including noncontrolling interests Adjustments to reconcile net earnings to net cash provided by operating activities: Depreciation and amortization Deferred income taxes, net Income earned from equity method investees Distributions received from equity method investees Stock-based compensation Non-cash lease costs Loss on retirement and impairment of assets Other Cash provided by used in) changes in operating assets and liabilities: Accounts receivable Inventories Prepaid expenses and other current assets Income taxes payable Accounts payable Deferred revenue Operating lease liability Other operating assets and liabilities Net cash provided by operating activities INVESTING ACTIVITIES: Purchases of investments Sales of investments Maturities and calls of investments Additions to property, plant and equipment Other Net cash used in investing activities (13.1) 8.4 216.8 128.9 108.2 52.4 (1.029.8) 154.6 4,468.4 13.4 (51.7) (492.1) (1,224.5) (320.3) 92.0 (918.2) 70.5 107.1 (367.3) 130.4 298.7 (985.7) (62.3) (986.2) (297.4) 133.5 10.0 (1.138.4) (39.4) (1.331.7) (296.5) 215.6 (346.2) 1,1572 (220.7) 4.727.6 (1,250.0) 1916 (1,588.2) (94.2) FINANCING ACTIVITIES: Repayments of commercial paper Net proceeds from issuance of short-term debt Repayments of short-term debt Proceeds from issuance of long-term debt Repayments of long-term debt Proceeds from issuance of common stock Cash dividends paid Repurchase of common stock Minimum tax withholdings on share-based awards Other Net cash provided by used in) financing activities Effect of exchange rate changes on cash and cash equivalents Net increase in cash and cash equivalents CASH AND CASH EQUIVALENTS: Beginning of period End of period SUPPLEMENTAL DISCLOSURE OF CASH FLOW INFORMATION: Cash paid during the period for: Interest, net of capitalized interest Income taxes See Notes to Consolidated Financial Statements. 98.9 (1,444.2) (1.698.9) (89.1) (37.8) 2,493.0 10.9 1,279.3 (3,167.9) 879 402.2 4,350.9 4.753.1 2.686.6 3,965.9 373.6 $ 407.9 $ 274.3 1,691.1 S STARBUCKS CORPORATION CONSOLIDATED STATEMENTS OF EQUITY For the Quarters Ended June 27, 2021 and June 28, 2020 (in millions, except per share data, unaudited) Accumulated Common Stock Additional Other Paid in Retained Comprehensive Shareholders Noncontrolling Amount Capital Earnings/Deficio Income/Loss) Equity (Deficit Interests Total 1,177.9 $ 1.2 $ 595.4 5 (8,124.3) S (126.3) S (7,654.0) $ 5.7 S (7,648.3) 1.153.4 1,153.4 0.8 1.154.2 96,6 96.6 80.9 80.9 80.9 Shares 96.6 Balance, March 28, 2021 Net earings Other comprehensive income (loss) Stock-based compensation expense Exercise of stock options/vesting of RSUS Sale of common stock Cash dividends declared, $0.45 per share Balance, June 27, 2021 LO 0.1 41.7 11.3 41.7 11.3 41.7 11.3 (530.7) (7,501.6) 5 (530.7) (6.800.8) $ (530.7) S (6,794.3) 1.179.0 S 1.2 S 729.3 $ (29.7) S 6.5 1.168.1 S 1.2 S 41.1 $ (521.8) S (7,050.6) S (678.4) (7.530.1) S (678.4) (8.1) 42.3 (2.8) S (7.532.9) 0.3 (678.1) (8.1) 42.3 (8.1) 42.3 Balance, March 29, 2020 Net eamings/(loss) Other comprehensive income (loss) Stock-based compensation expense Exercise of stock options/vesting of RSUS Sale of common stock Cash dividends declared, $0.41 per share Balance, June 28, 2020 0.6 0.2 22.2 9.8 22.2 9.8 22.2 9.8 (479.3) (8,208.3) (4793) (8,621.6) (0.2) (479.5) (2.7) S (8,624.3) 1.168.9 S 1.2 115.4 (529.9) 5 See Notes to Consolidated Financial Statements
Step by Step Solution
There are 3 Steps involved in it

Get step-by-step solutions from verified subject matter experts