

Question: Section 4.2 T 3. Load factors by month Here is a display of the inter- national load factors by month for the period from 2000
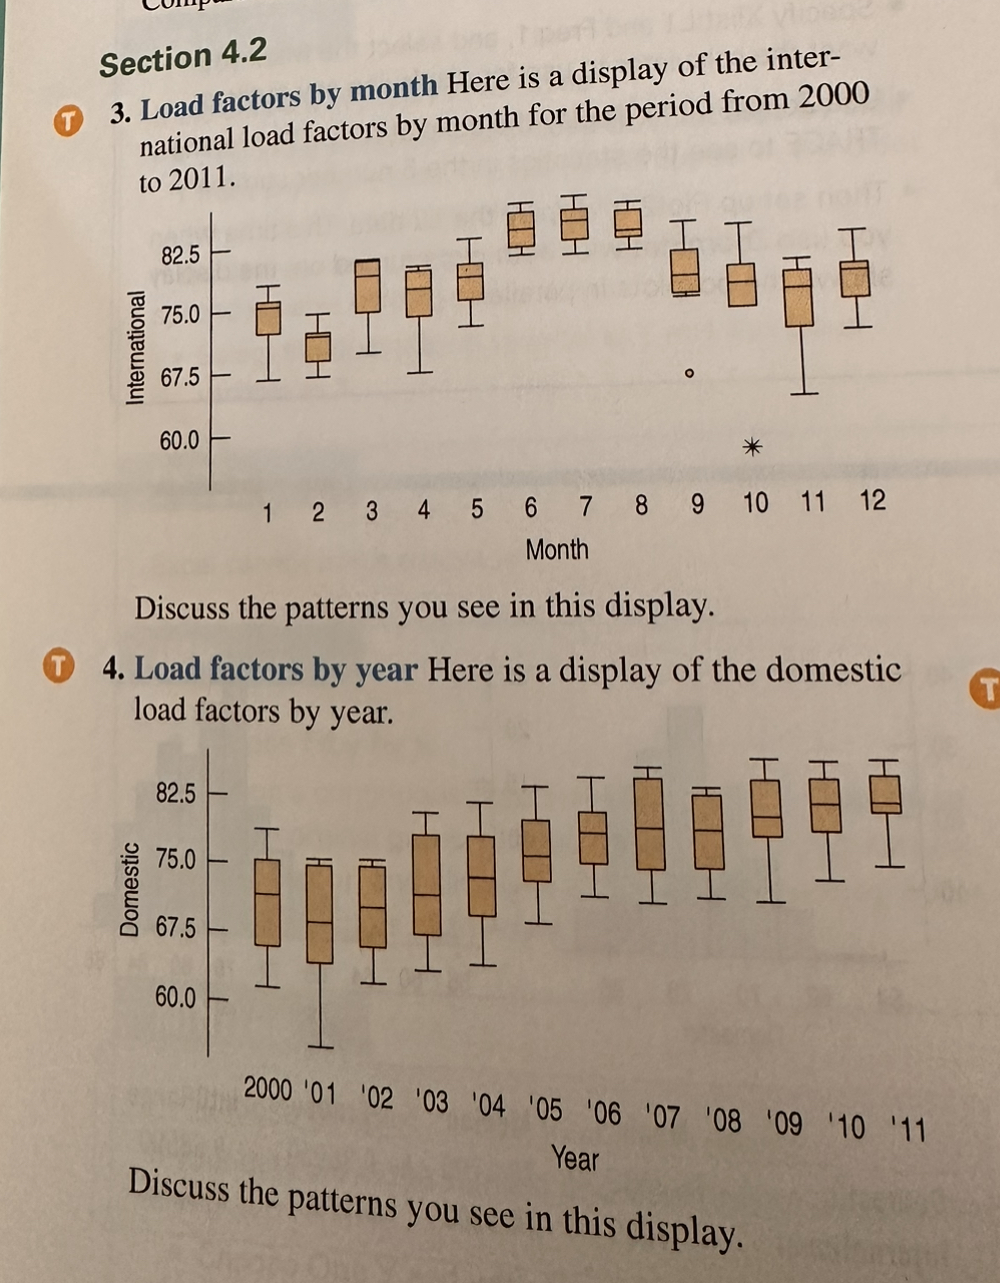
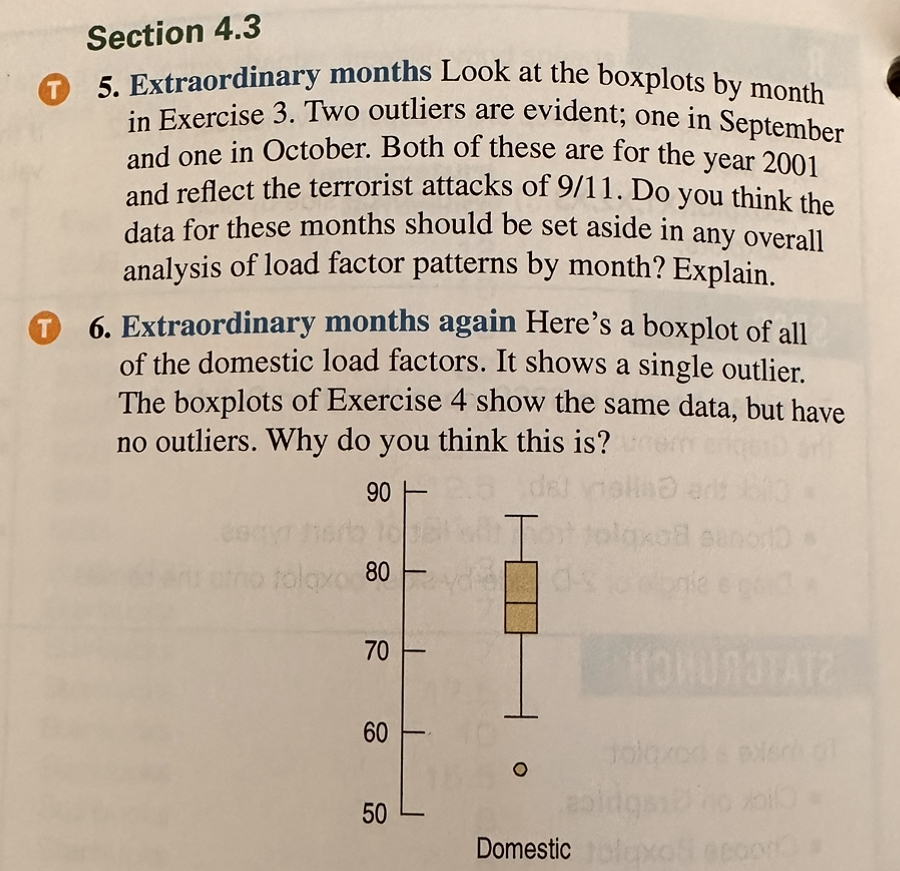
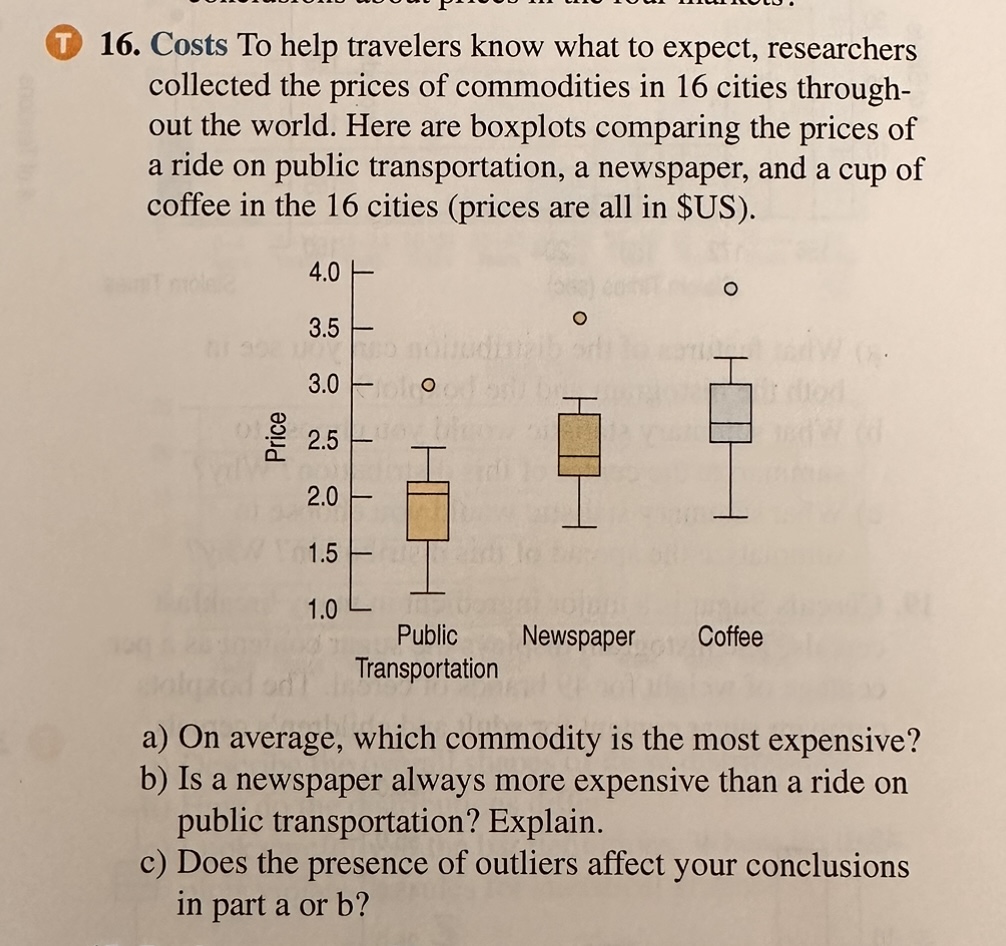
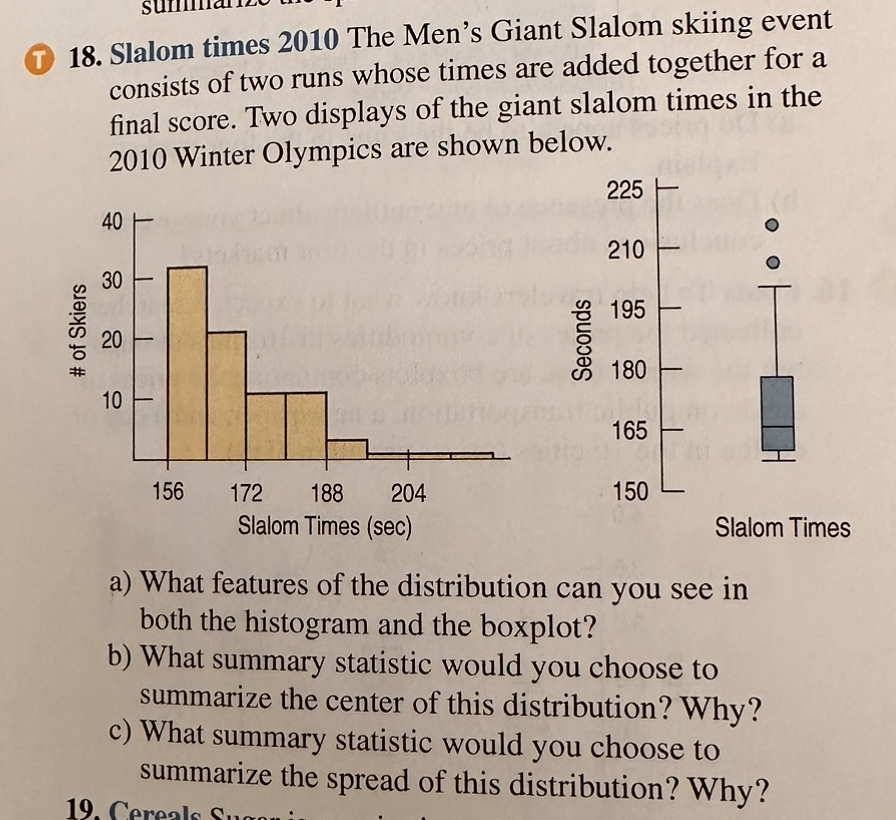
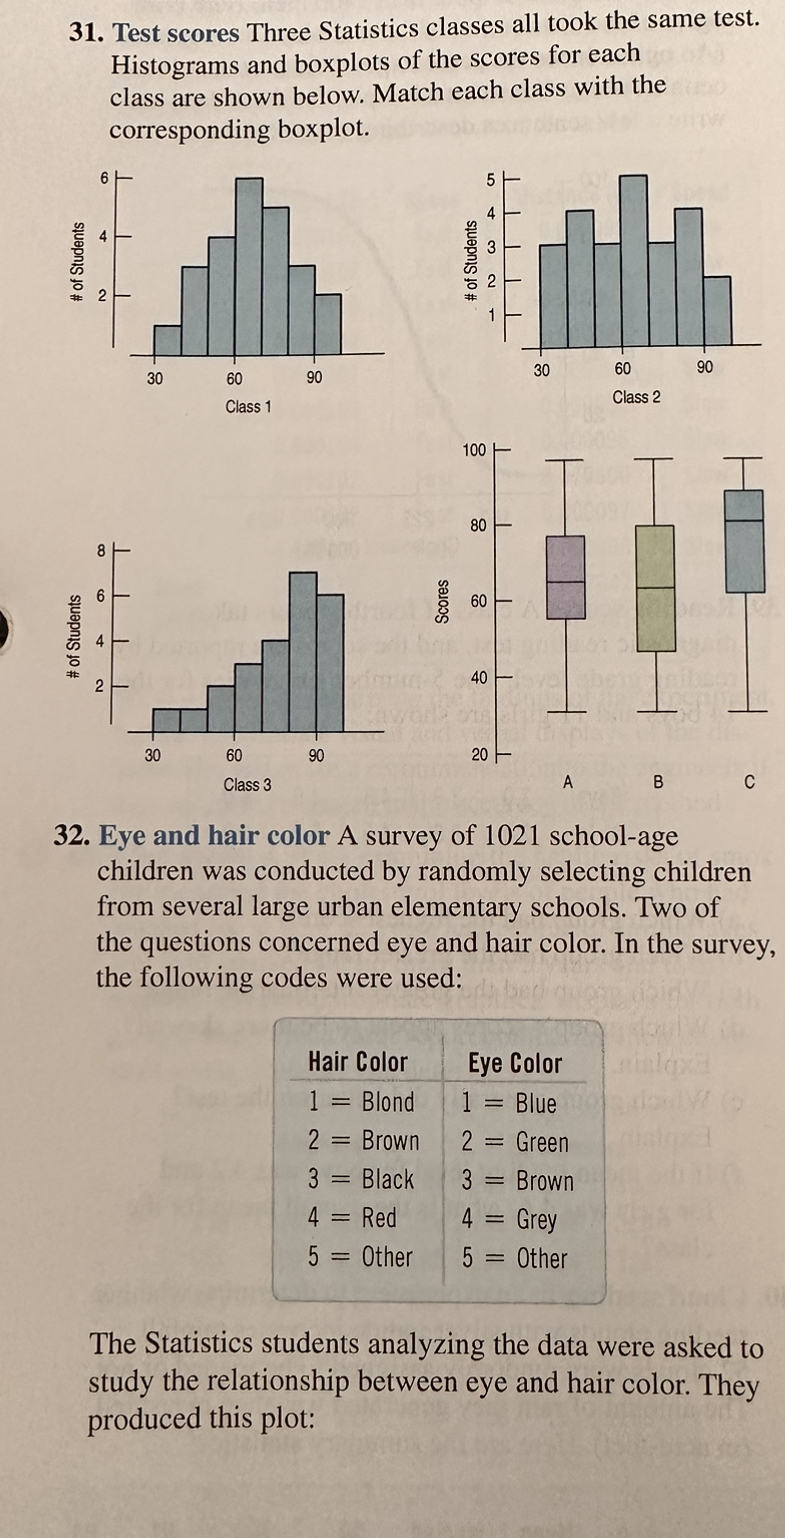
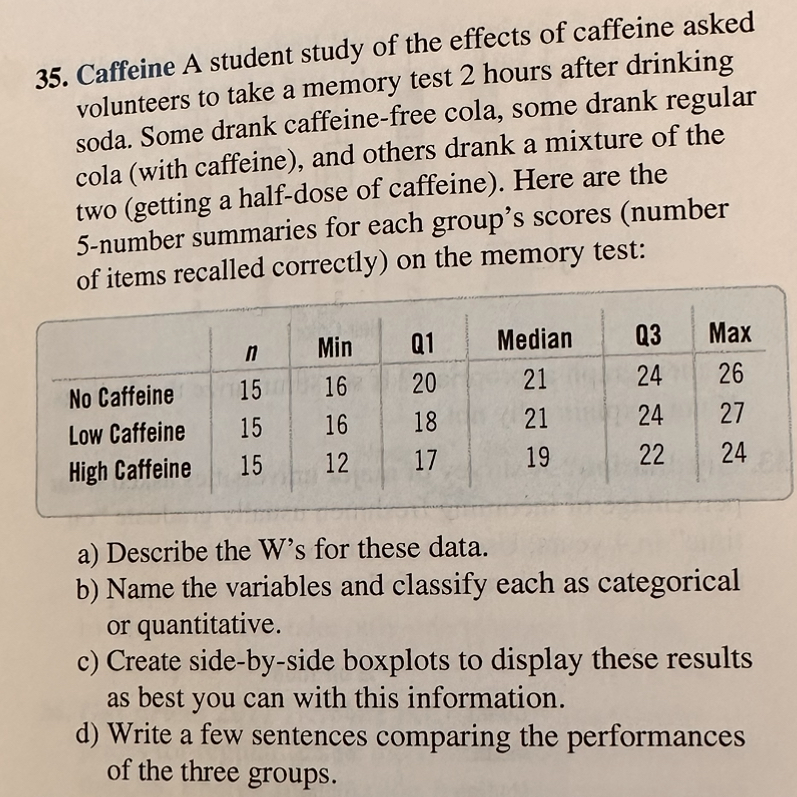
Section 4.2 T 3. Load factors by month Here is a display of the inter- national load factors by month for the period from 2000 to 2011. HH HIH HTH 82.5 H HH H 75.0 International 67.5 60.0 * 1 3 4 5 6 7 8 9 10 11 12 Month Discuss the patterns you see in this display. T 4. Load factors by year Here is a display of the domestic load factors by year. 82.5 75.0 Domestic 67.5 60.0 2000 '01 02 03 04 05 06 07 08 09 10 '11 Year Discuss the patterns you see in this display.Section 4.3 T 5. Extraordinary months Look at the boxplots by month in Exercise 3. Two outliers are evident; one in September and one in October. Both of these are for the year 2001 and reflect the terrorist attacks of 9/11. Do you think the data for these months should be set aside in any overall analysis of load factor patterns by month? Explain. T 6. Extraordinary months again Here's a boxplot of all of the domestic load factors. It shows a single outlier. The boxplots of Exercise 4 show the same data, but have no outliers. Why do you think this is? 90 T it toloxed sunord s 70 HOWUROTATE 60 O 50 Domestic Joluxold agood.T 16. Costs To help travelers know what to expect, researchers collected the prices of commodities in 16 cities through- out the world. Here are boxplots comparing the prices of a ride on public transportation, a newspaper, and a cup of coffee in the 16 cities (prices are all in $US). 4.0 O 3.5 O 3.0 O Price 2.5 2.0 1.5 1.0 Public Newspaper Coffee Bolazed ed Transportation a) On average, which commodity is the most expensive? b) Is a newspaper always more expensive than a ride on public transportation? Explain. c) Does the presence of outliers affect your conclusions in part a or b?SUIIIIII 18. Slalom times 2010 The Men's Giant Slalom skiing event T consists of two runs whose times are added together for a final score. Two displays of the giant slalom times in the 2010 Winter Olympics are shown below. 225 40 O 210 O 30 195 # of Skiers 20 Seconds 180 10 165 156 172 188 204 150 Slalom Times (sec) Slalom Times a) What features of the distribution can you see in both the histogram and the boxplot? b) What summary statistic would you choose to summarize the center of this distribution? Why? c) What summary statistic would you choose to summarize the spread of this distribution? Why? 19. Cere31. Test scores Three Statistics classes all took the same test. Histograms and boxplots of the scores for each class are shown below. Match each class with the corresponding boxplot. 4 # of Students # of Students 2 30 60 90 30 60 90 Class 2 Class 1 100 80 8 6 Scores 60 # of Students 40 2 30 60 90 20 Class 3 A B C 32. Eye and hair color A survey of 1021 school-age children was conducted by randomly selecting children from several large urban elementary schools. Two of the questions concerned eye and hair color. In the survey, the following codes were used: Hair Color Eye Color nihlaxa 1 = Blond 1 = Blue 2 = Brown 2 = Green 3 = Black 3 = Brown 4 = Red 4 = Grey 5 = Other 5 = Other The Statistics students analyzing the data were asked to study the relationship between eye and hair color. They produced this plot:35. Caffeine A student study of the effects of caffeine asked volunteers to take a memory test 2 hours after drinking soda. Some drank caffeine-free cola, some drank regular cola (with caffeine), and others drank a mixture of the two (getting a half-dose of caffeine). Here are the 5-number summaries for each group's scores (number of items recalled correctly) on the memory test: n Min Q1 Median Q3 Max No Caffeine 15 16 20 21 24 26 Low Caffeine 15 16 18 21 24 27 High Caffeine 15 12 17 19 22 24 a) Describe the W's for these data. b) Name the variables and classify each as categorical or quantitative. c) Create side-by-side boxplots to display these results as best you can with this information. d) Write a few sentences comparing the performances of the three groups
Step by Step Solution
There are 3 Steps involved in it

Get step-by-step solutions from verified subject matter experts