

Question: Section 5 - Topic 1 Real-World Examples of Quadratic Functions 2. The heig a buildi 1 . The function below shows the revenue for t-shirt
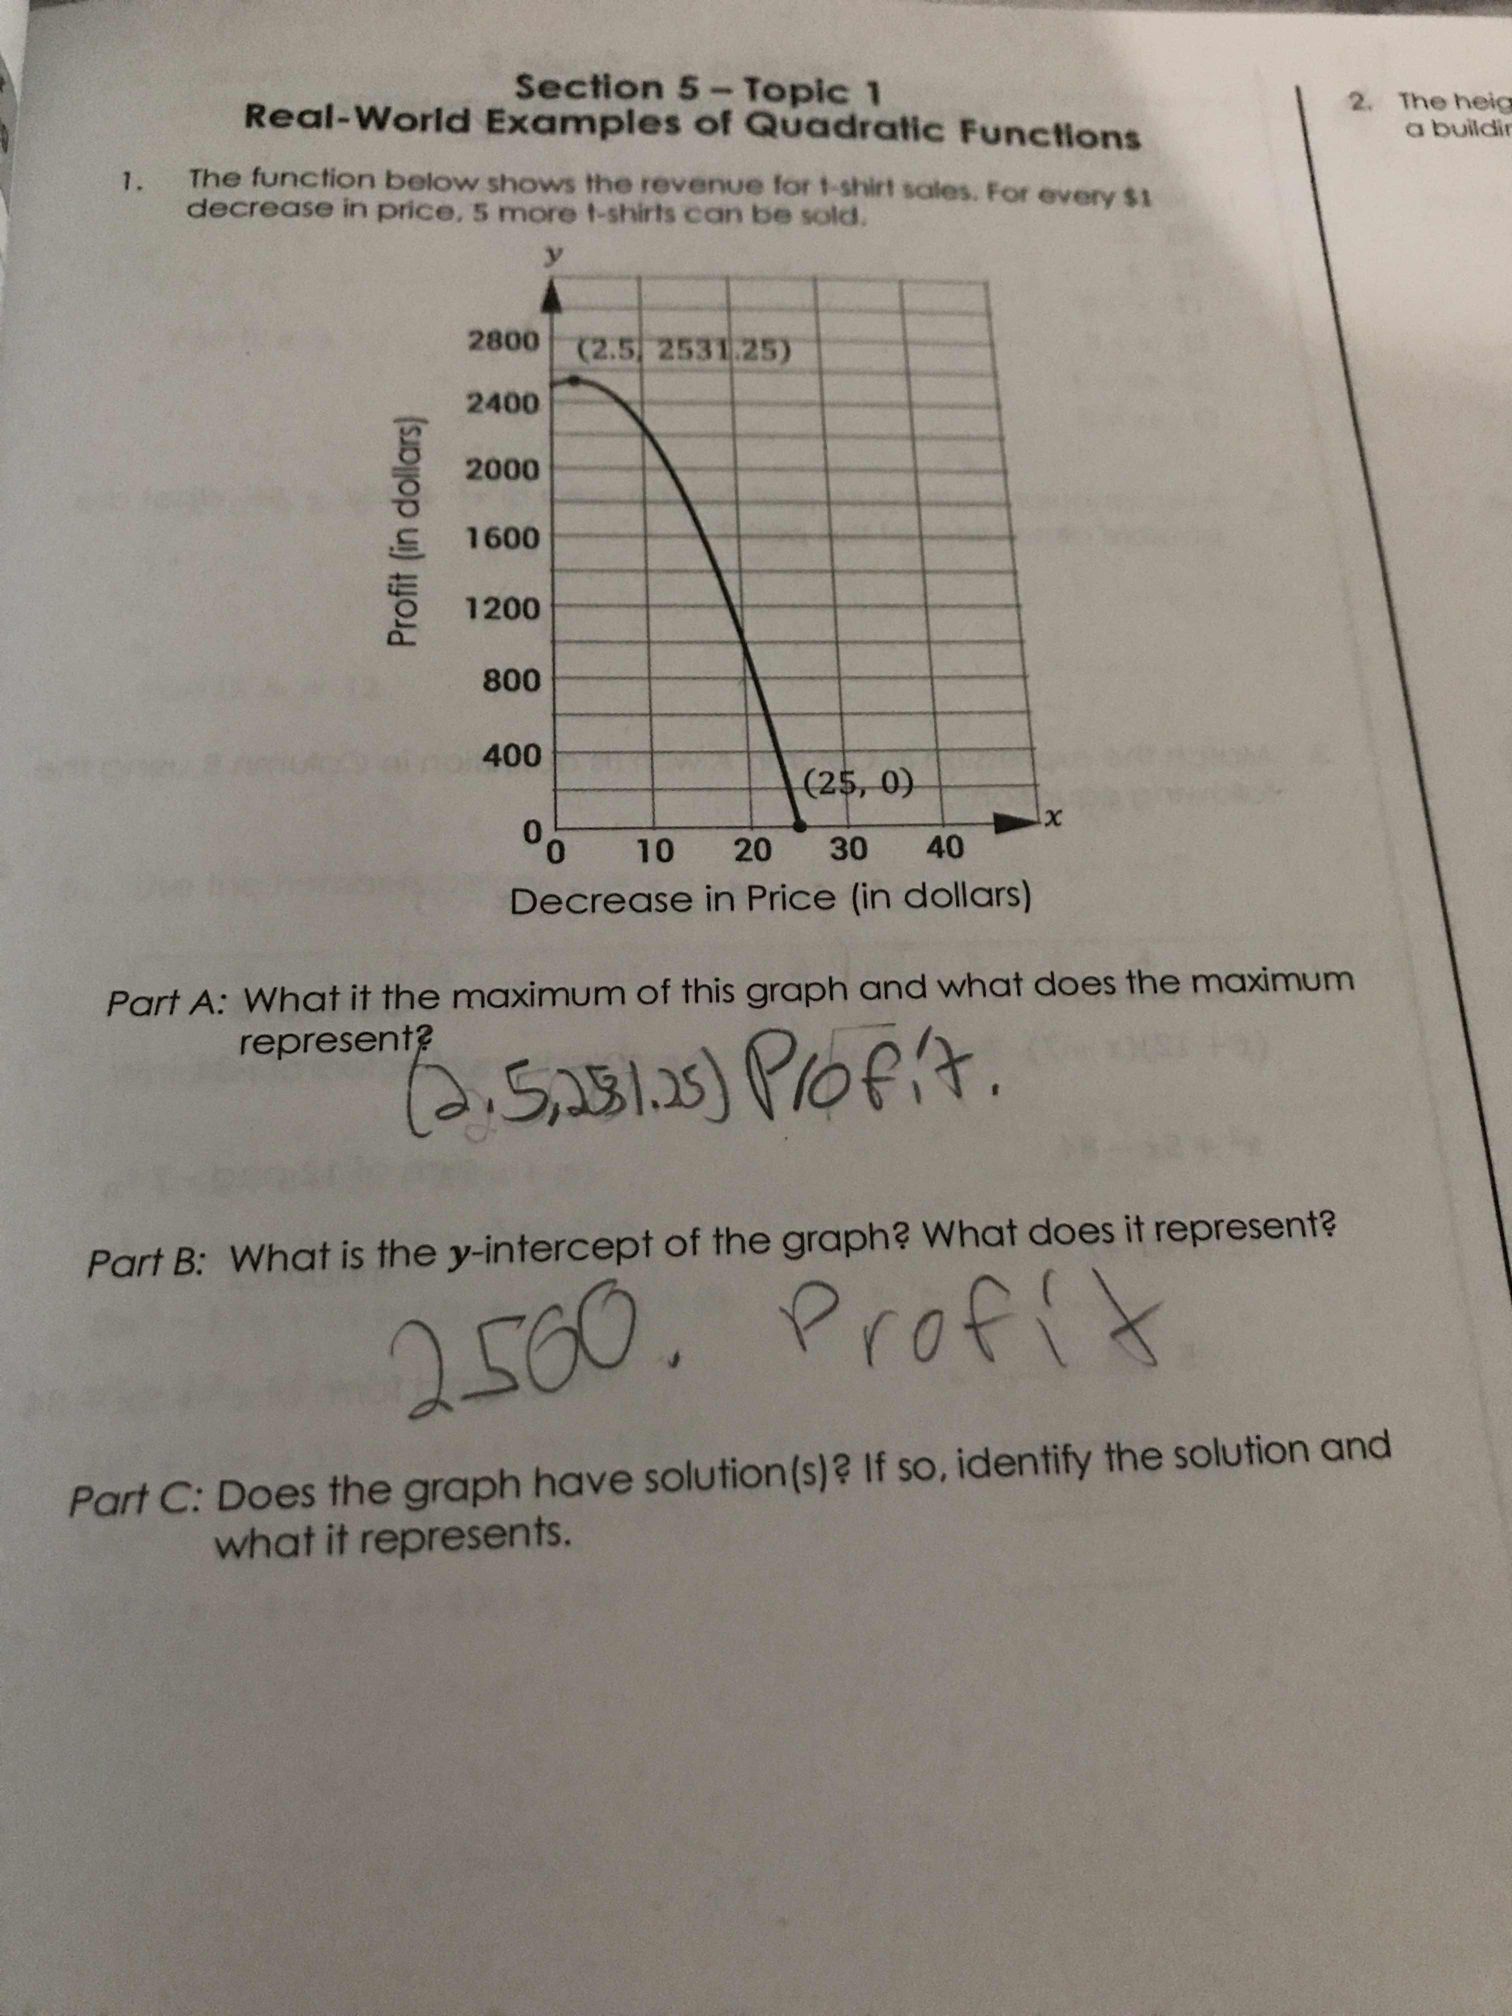
Section 5 - Topic 1 Real-World Examples of Quadratic Functions 2. The heig a buildi 1 . The function below shows the revenue for t-shirt sales. For every $1 decrease in price, 5 more t-shirts can be sold. 2800 (2.5 2531.25) Profit (in dollars) 2400 2000 1600 1200 800 400 ( 25, 0) 0 10 20 30 40 Decrease in Price (in dollars) Part A: What it the maximum of this graph and what does the maximum represent? ( 2. 5, 281 25) Profit Part B: What is the y-intercept of the graph? What does it represent? 2560. Profit Part C: Does the graph have solution (s) ? If so, identify the solution and what it represents
Step by Step Solution
There are 3 Steps involved in it
1 Expert Approved Answer
Step: 1 Unlock

Question Has Been Solved by an Expert!
Get step-by-step solutions from verified subject matter experts
Step: 2 Unlock
Step: 3 Unlock