

Question: Section 6.1 Question 4 ff.. ... Which graph represents P14? Choose the correct graph below. OA. OB. O C. O D. X P 14 P
Section 6.1
Question 4
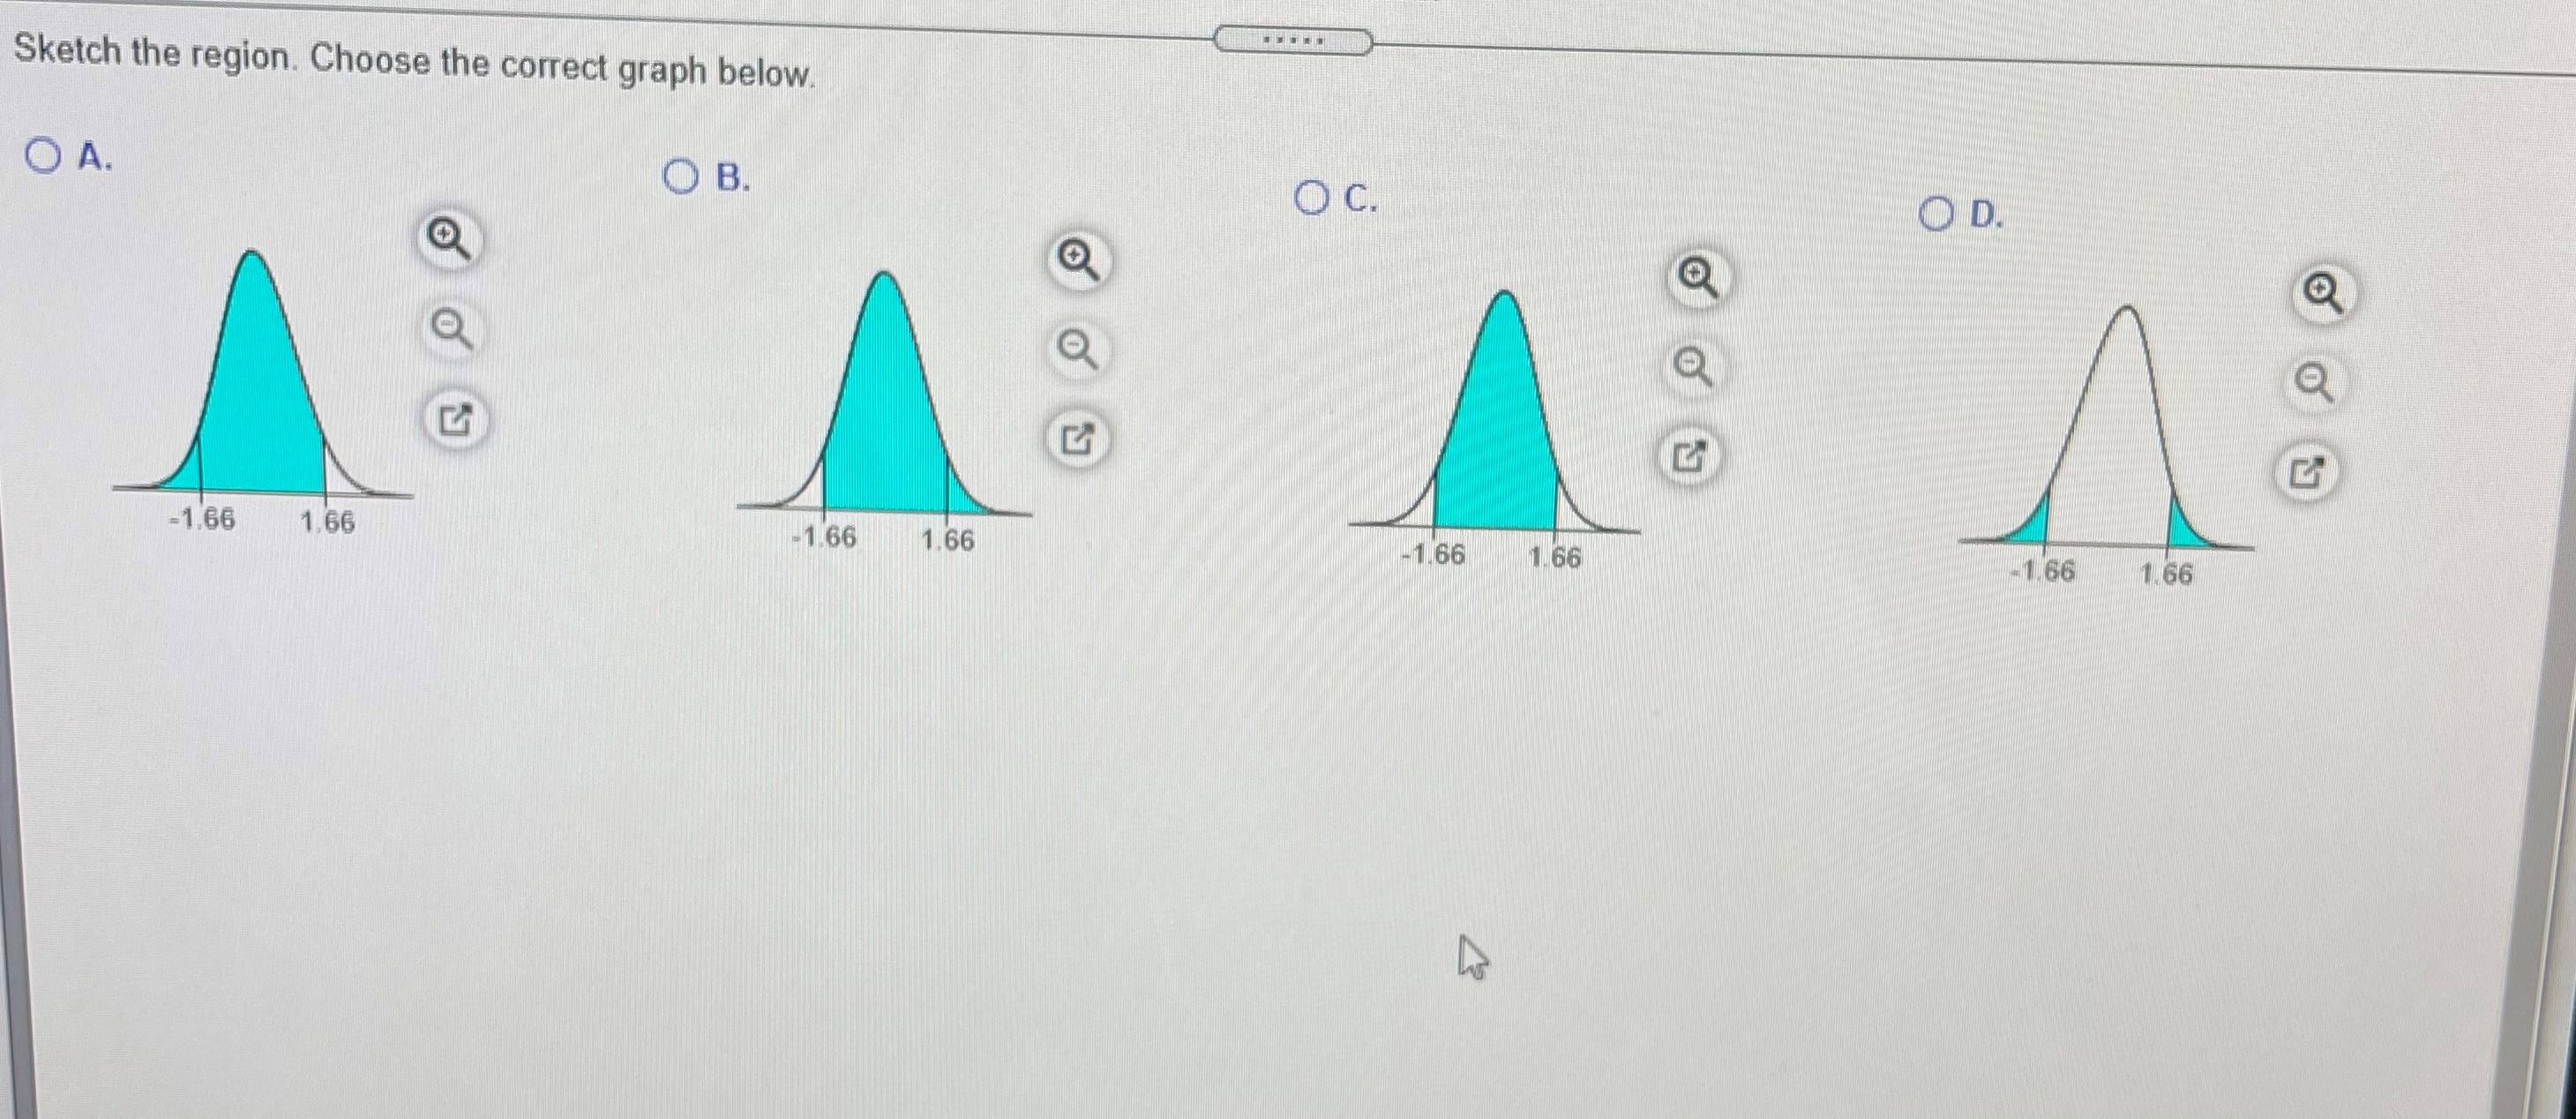
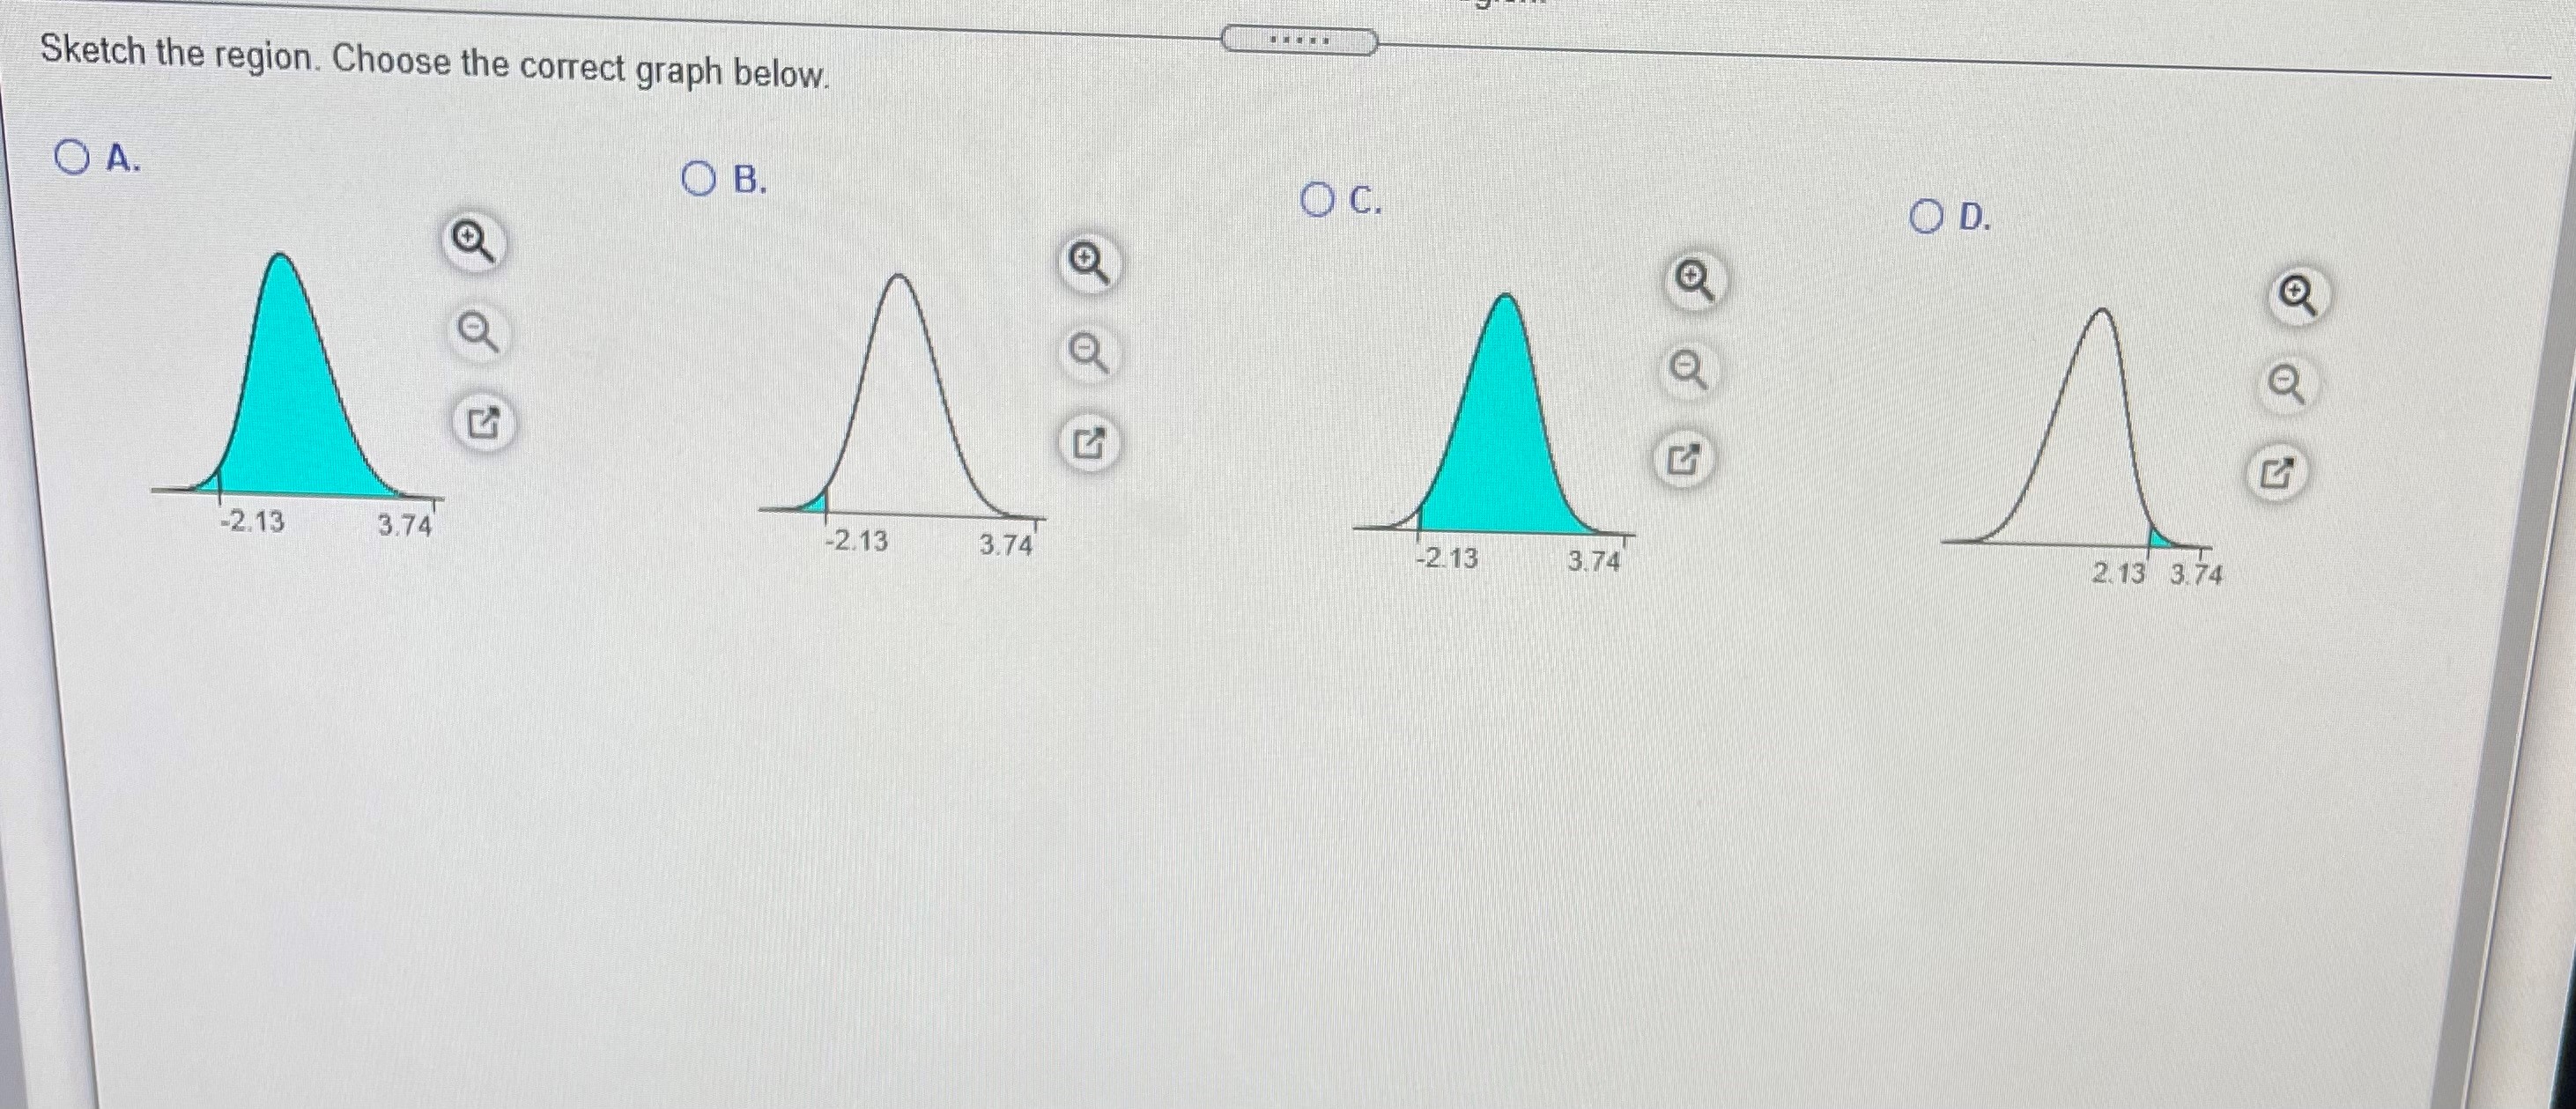
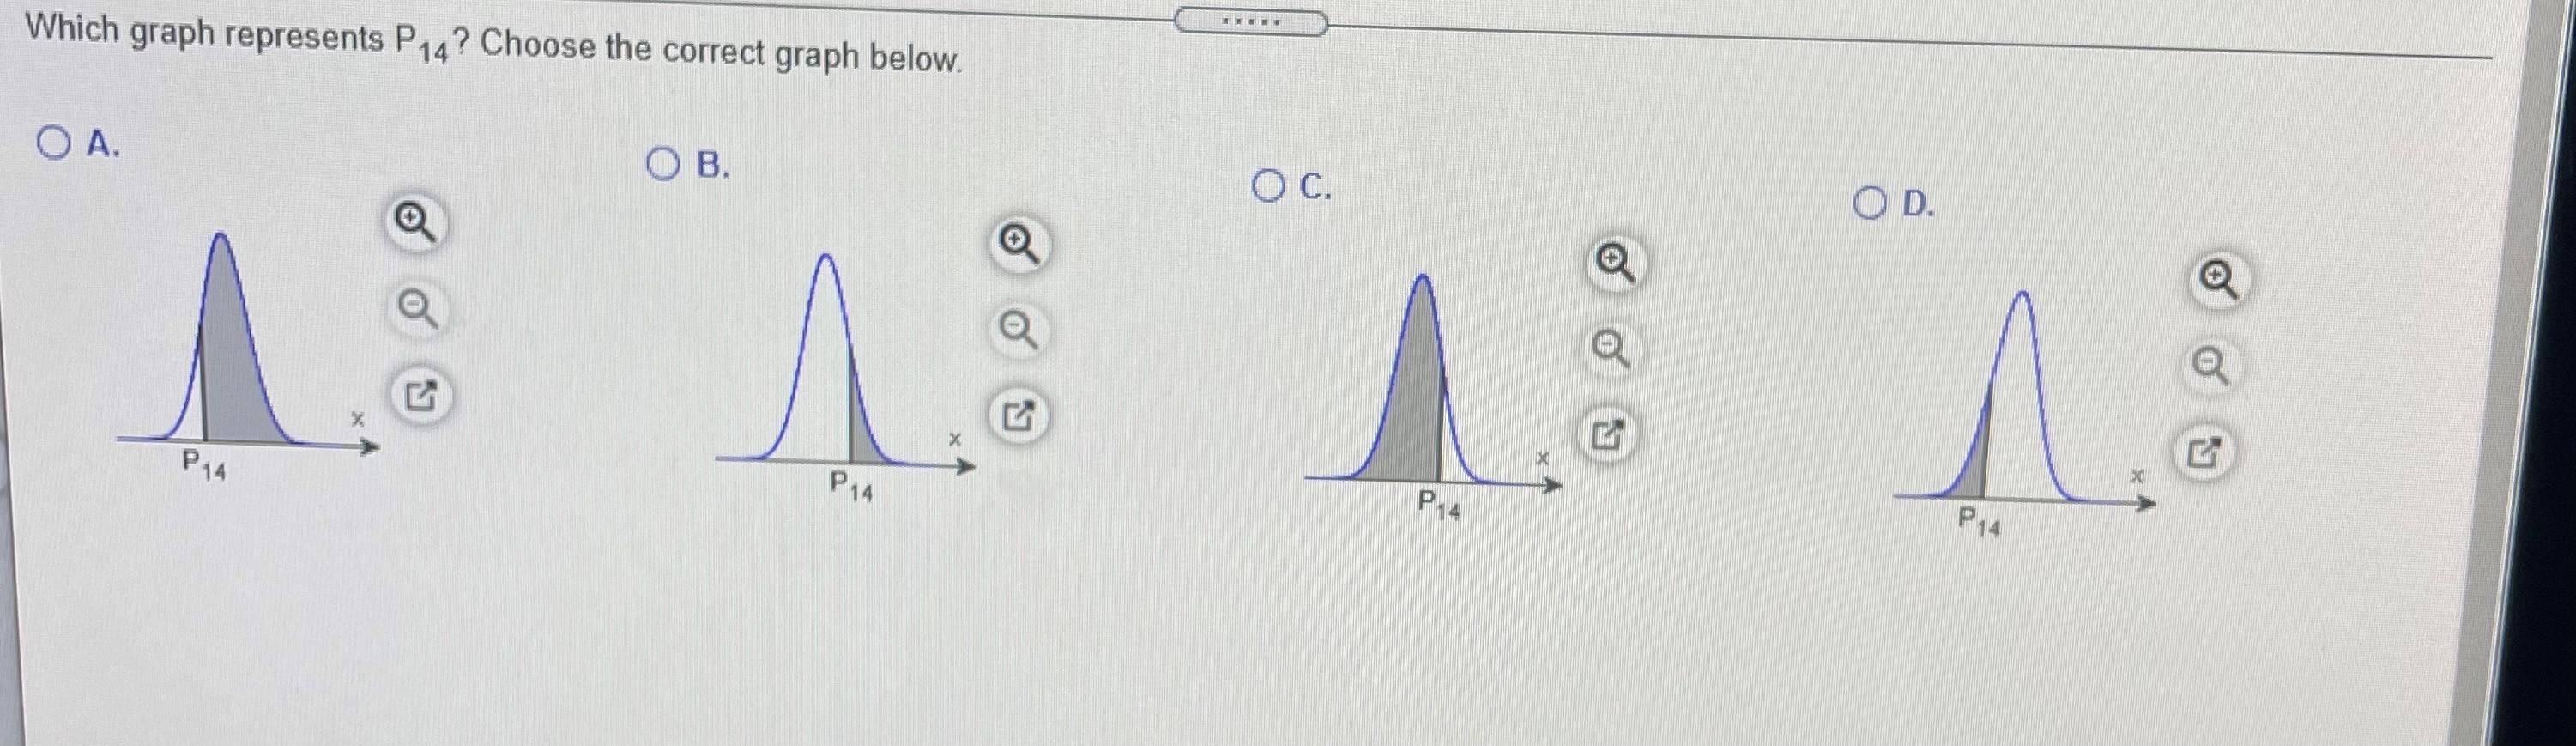
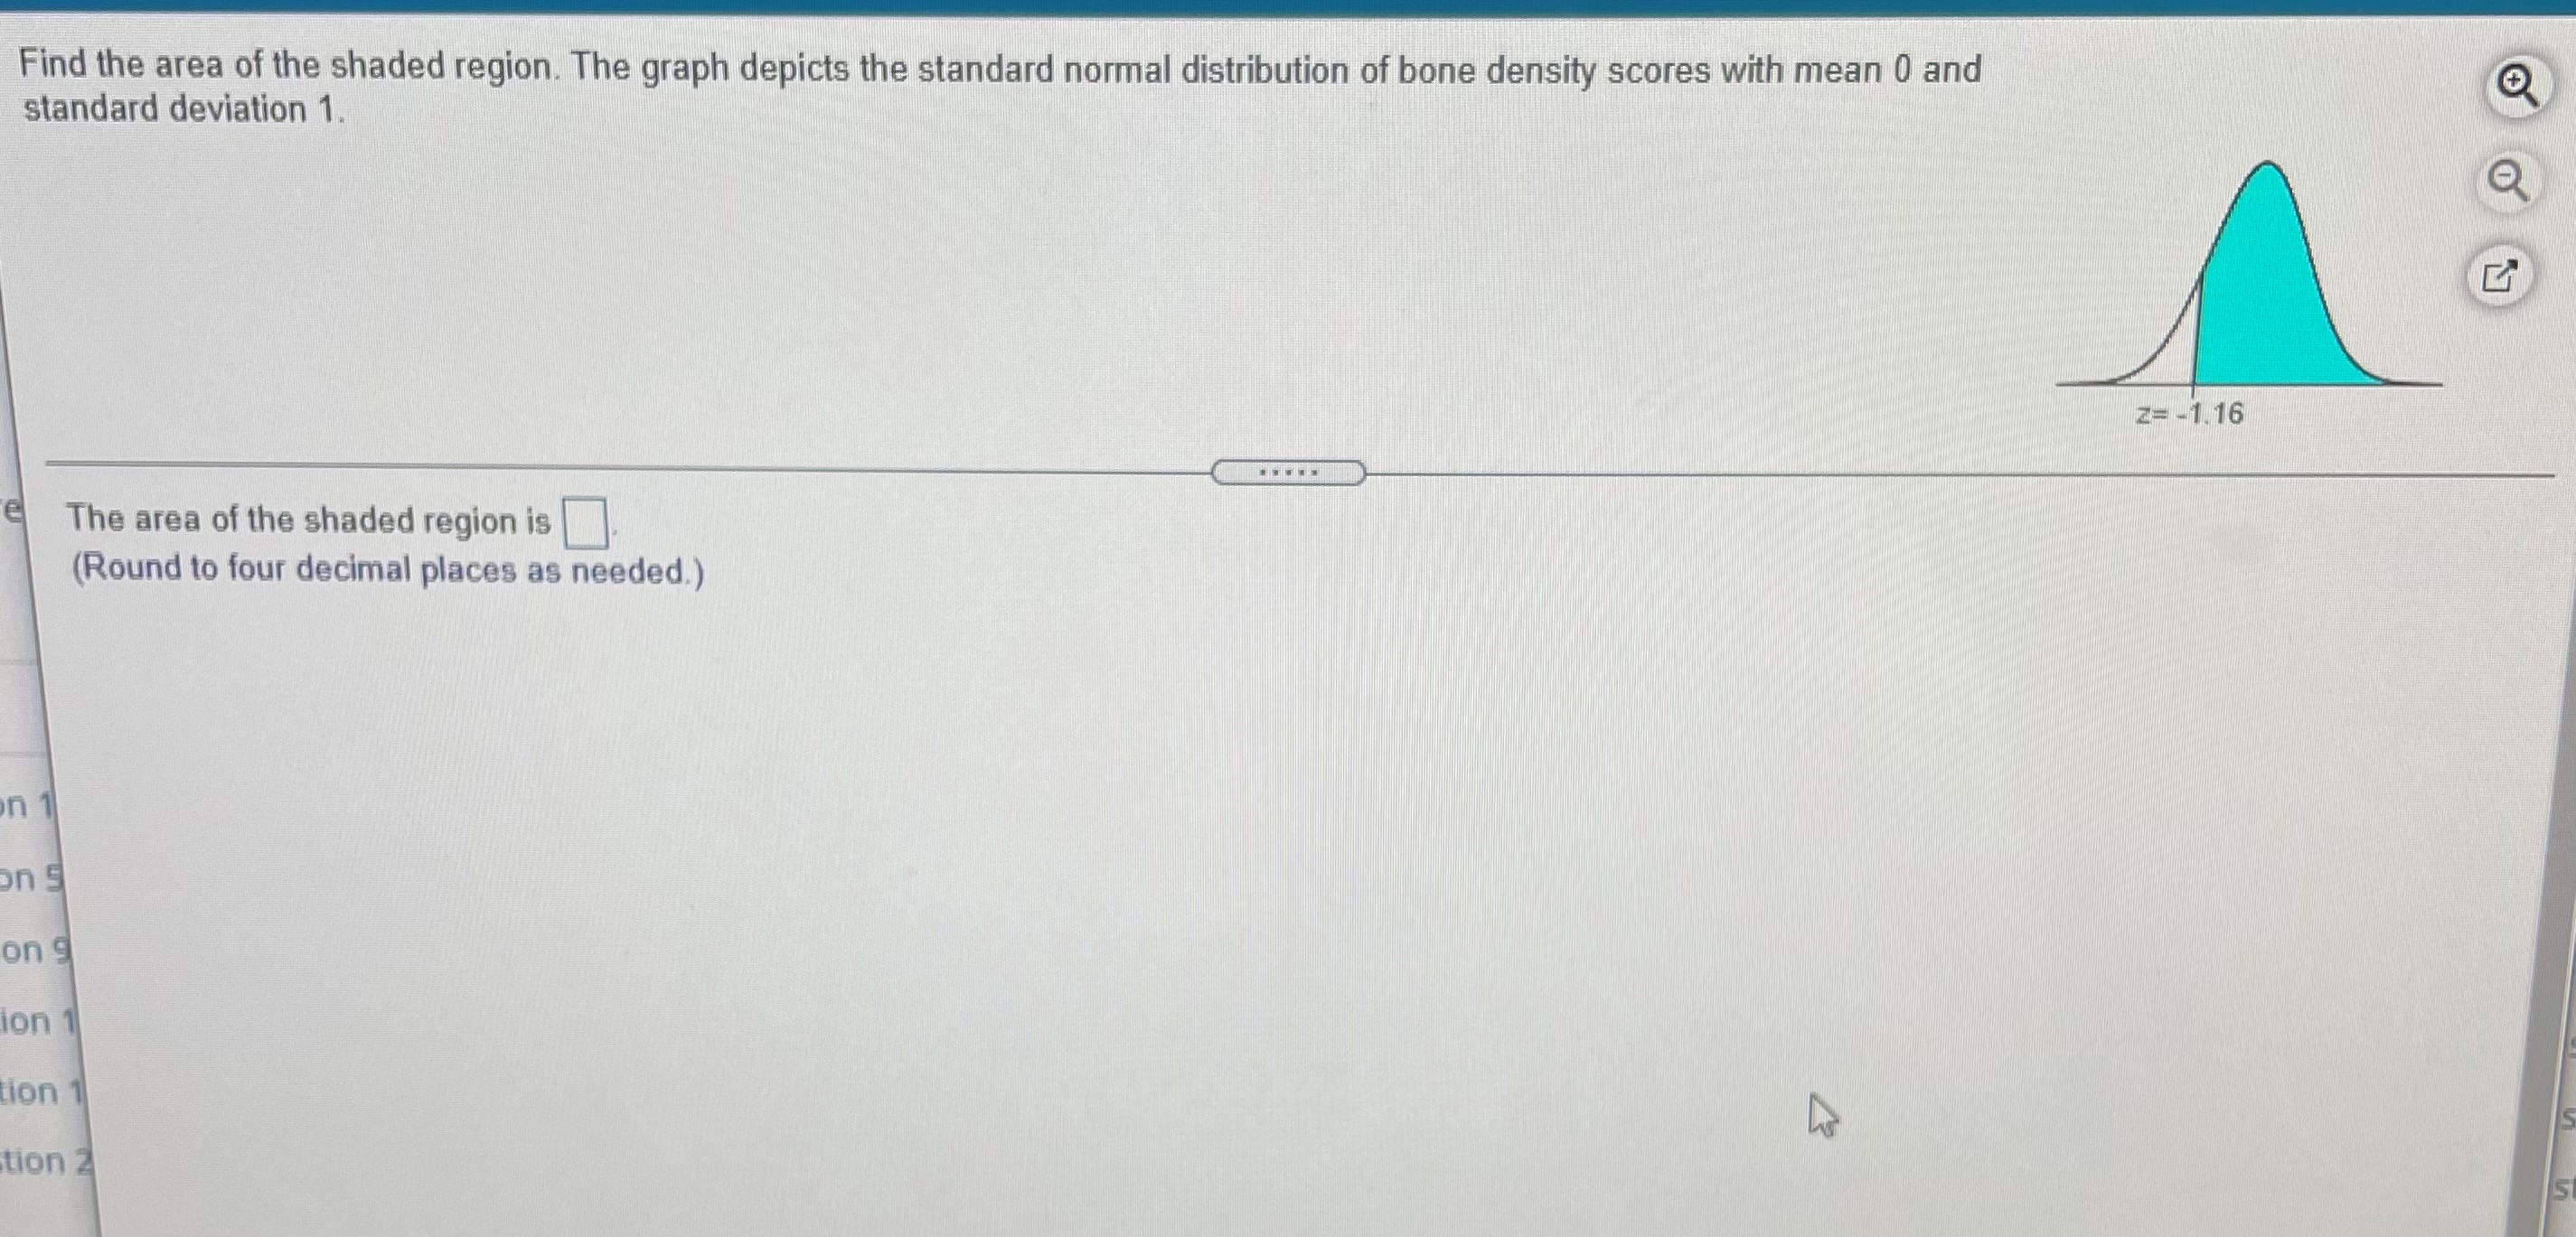
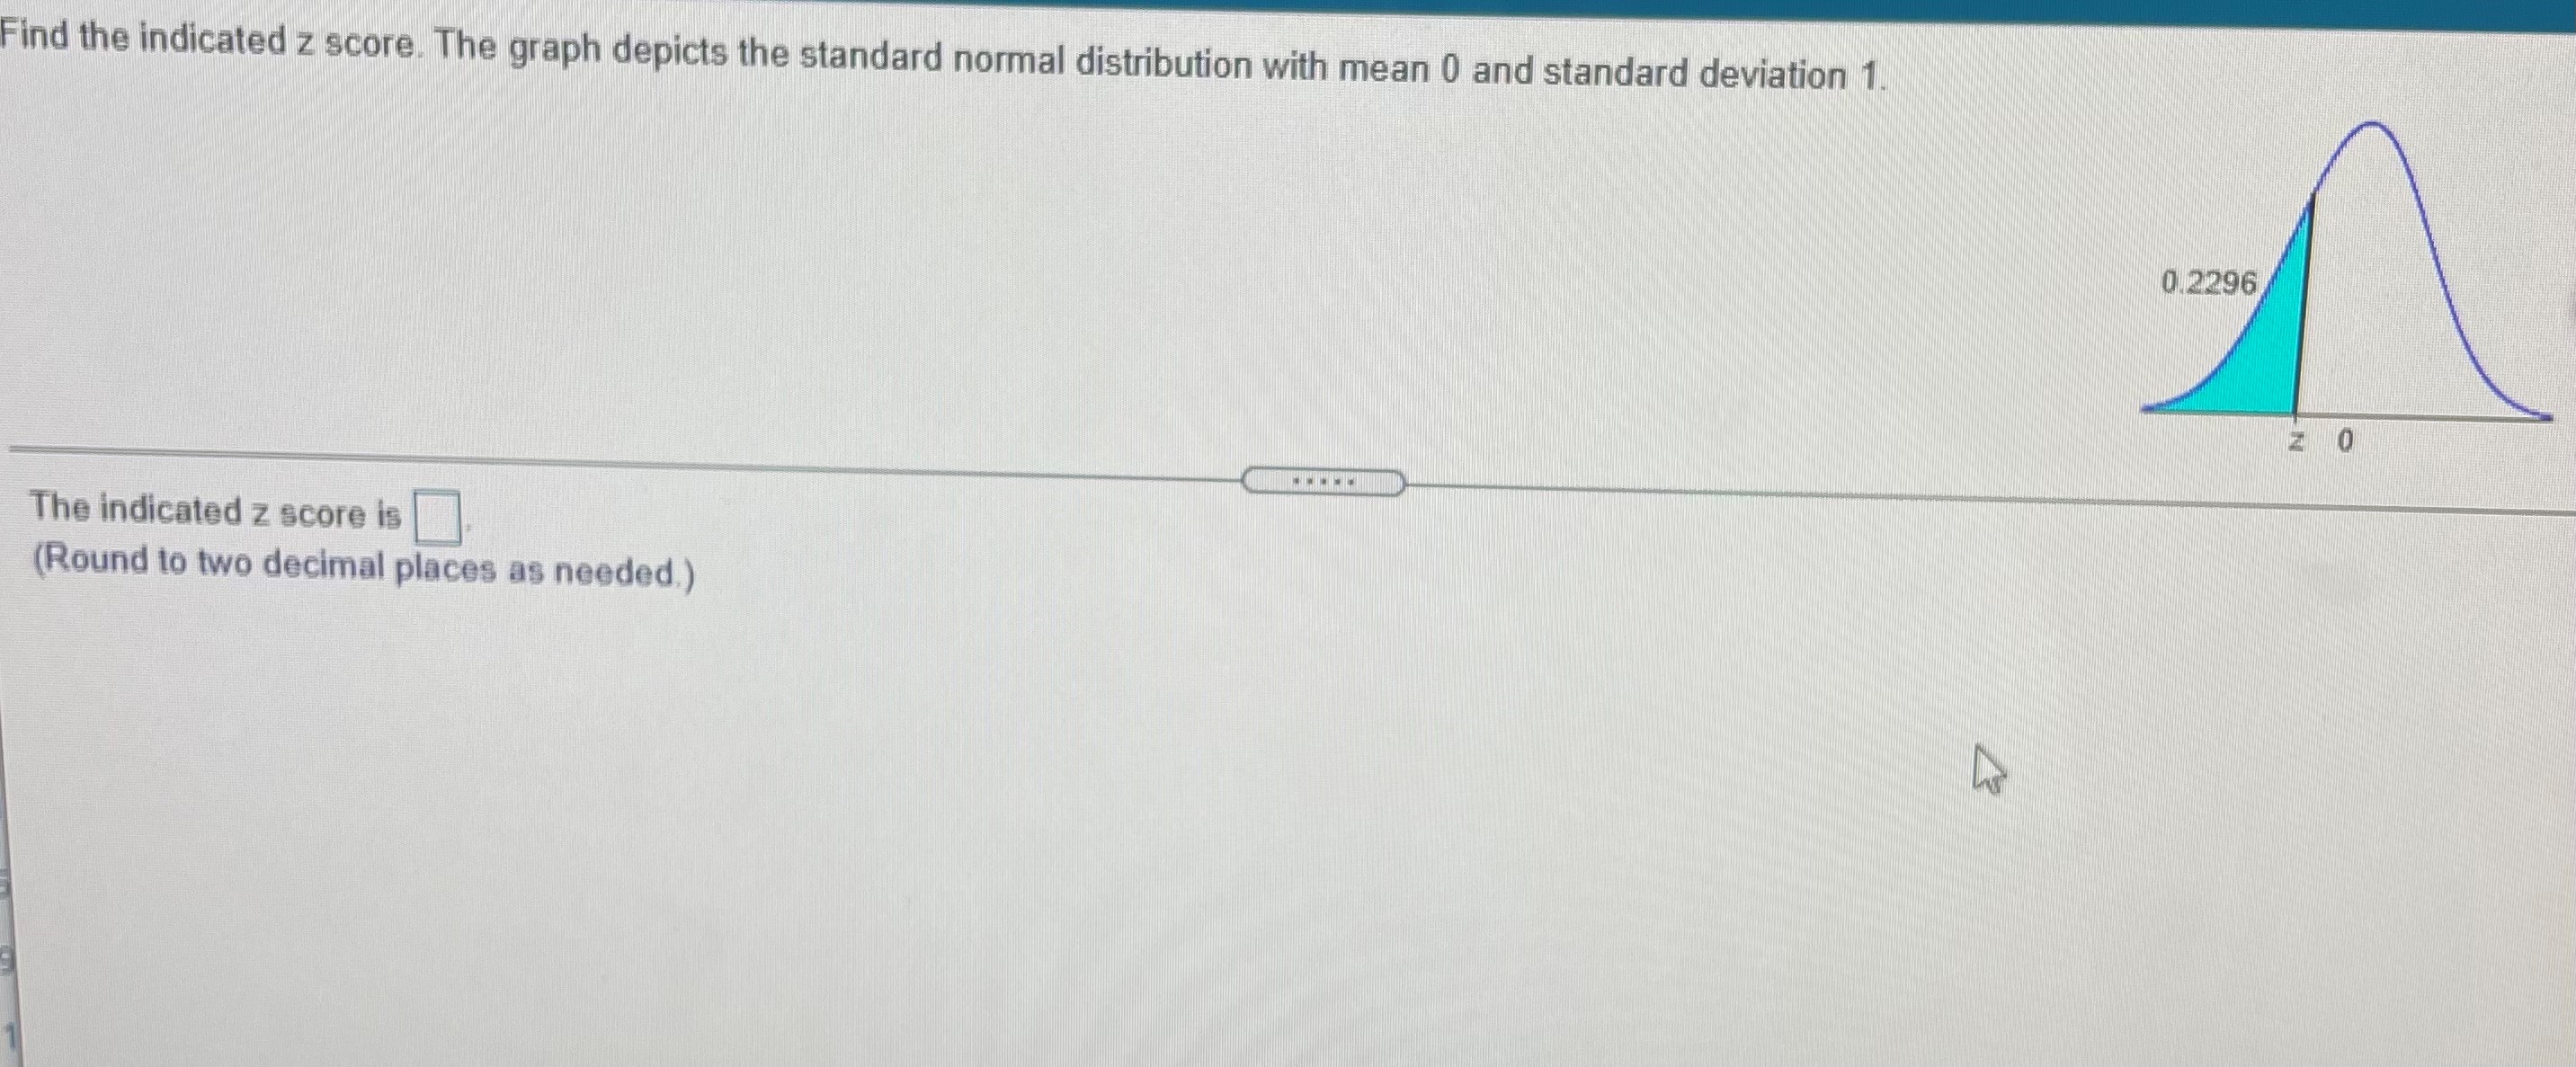
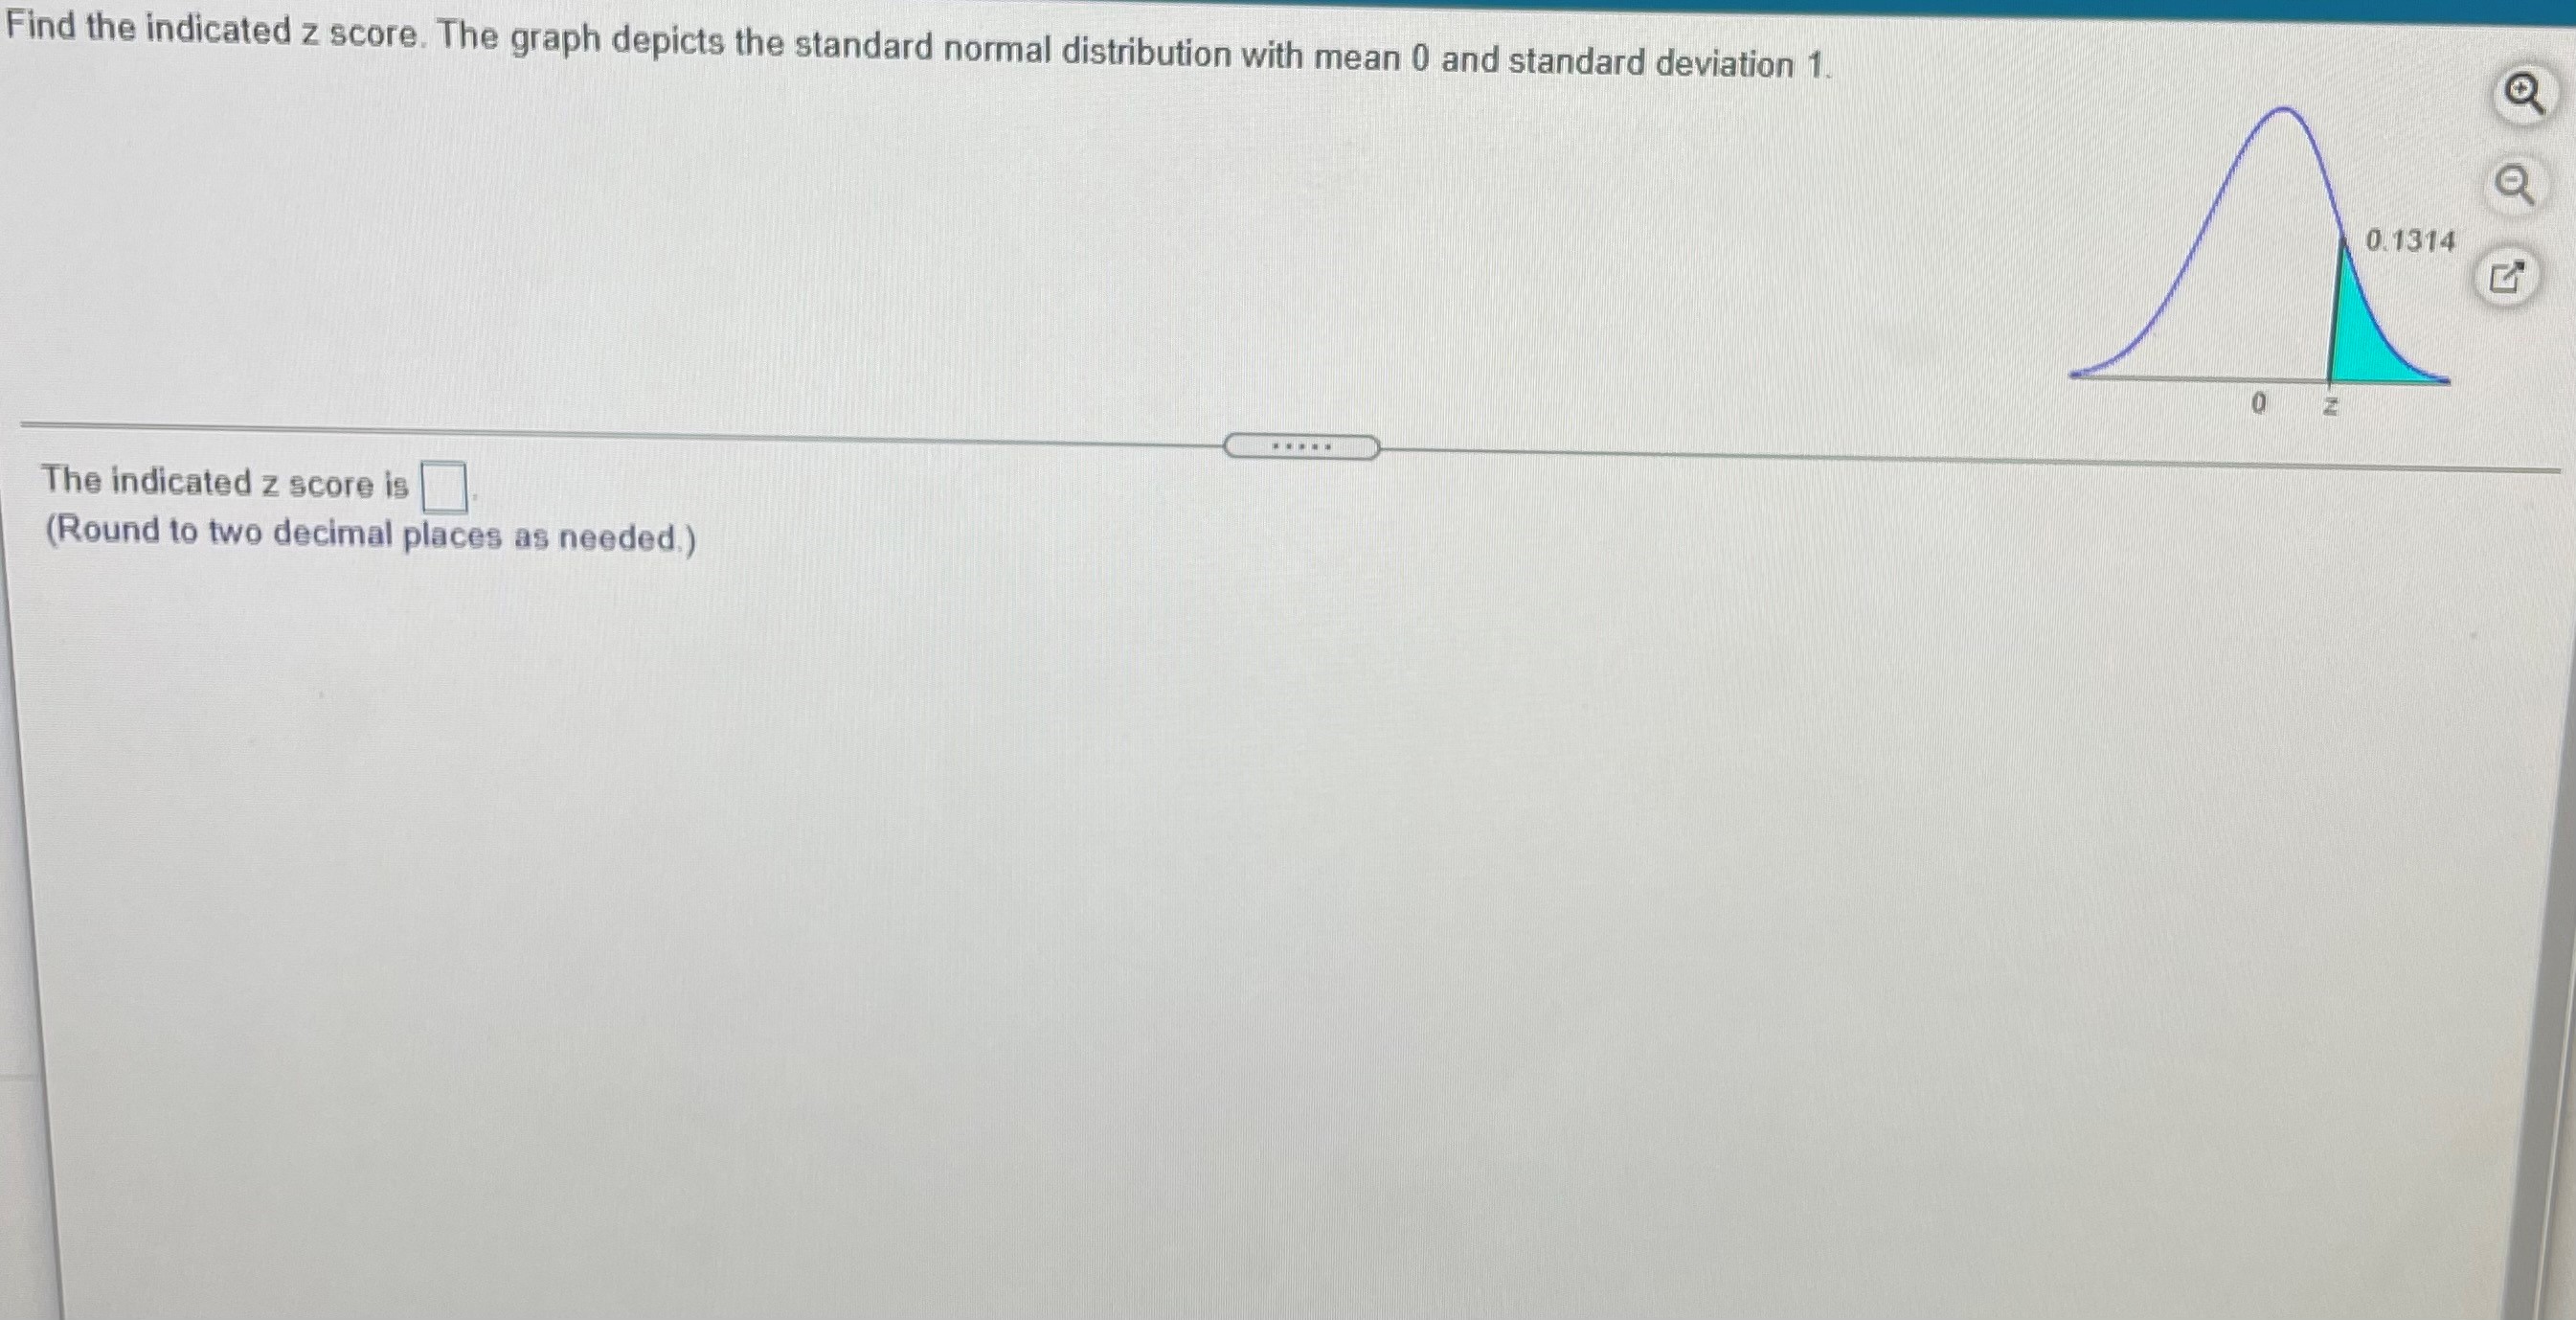
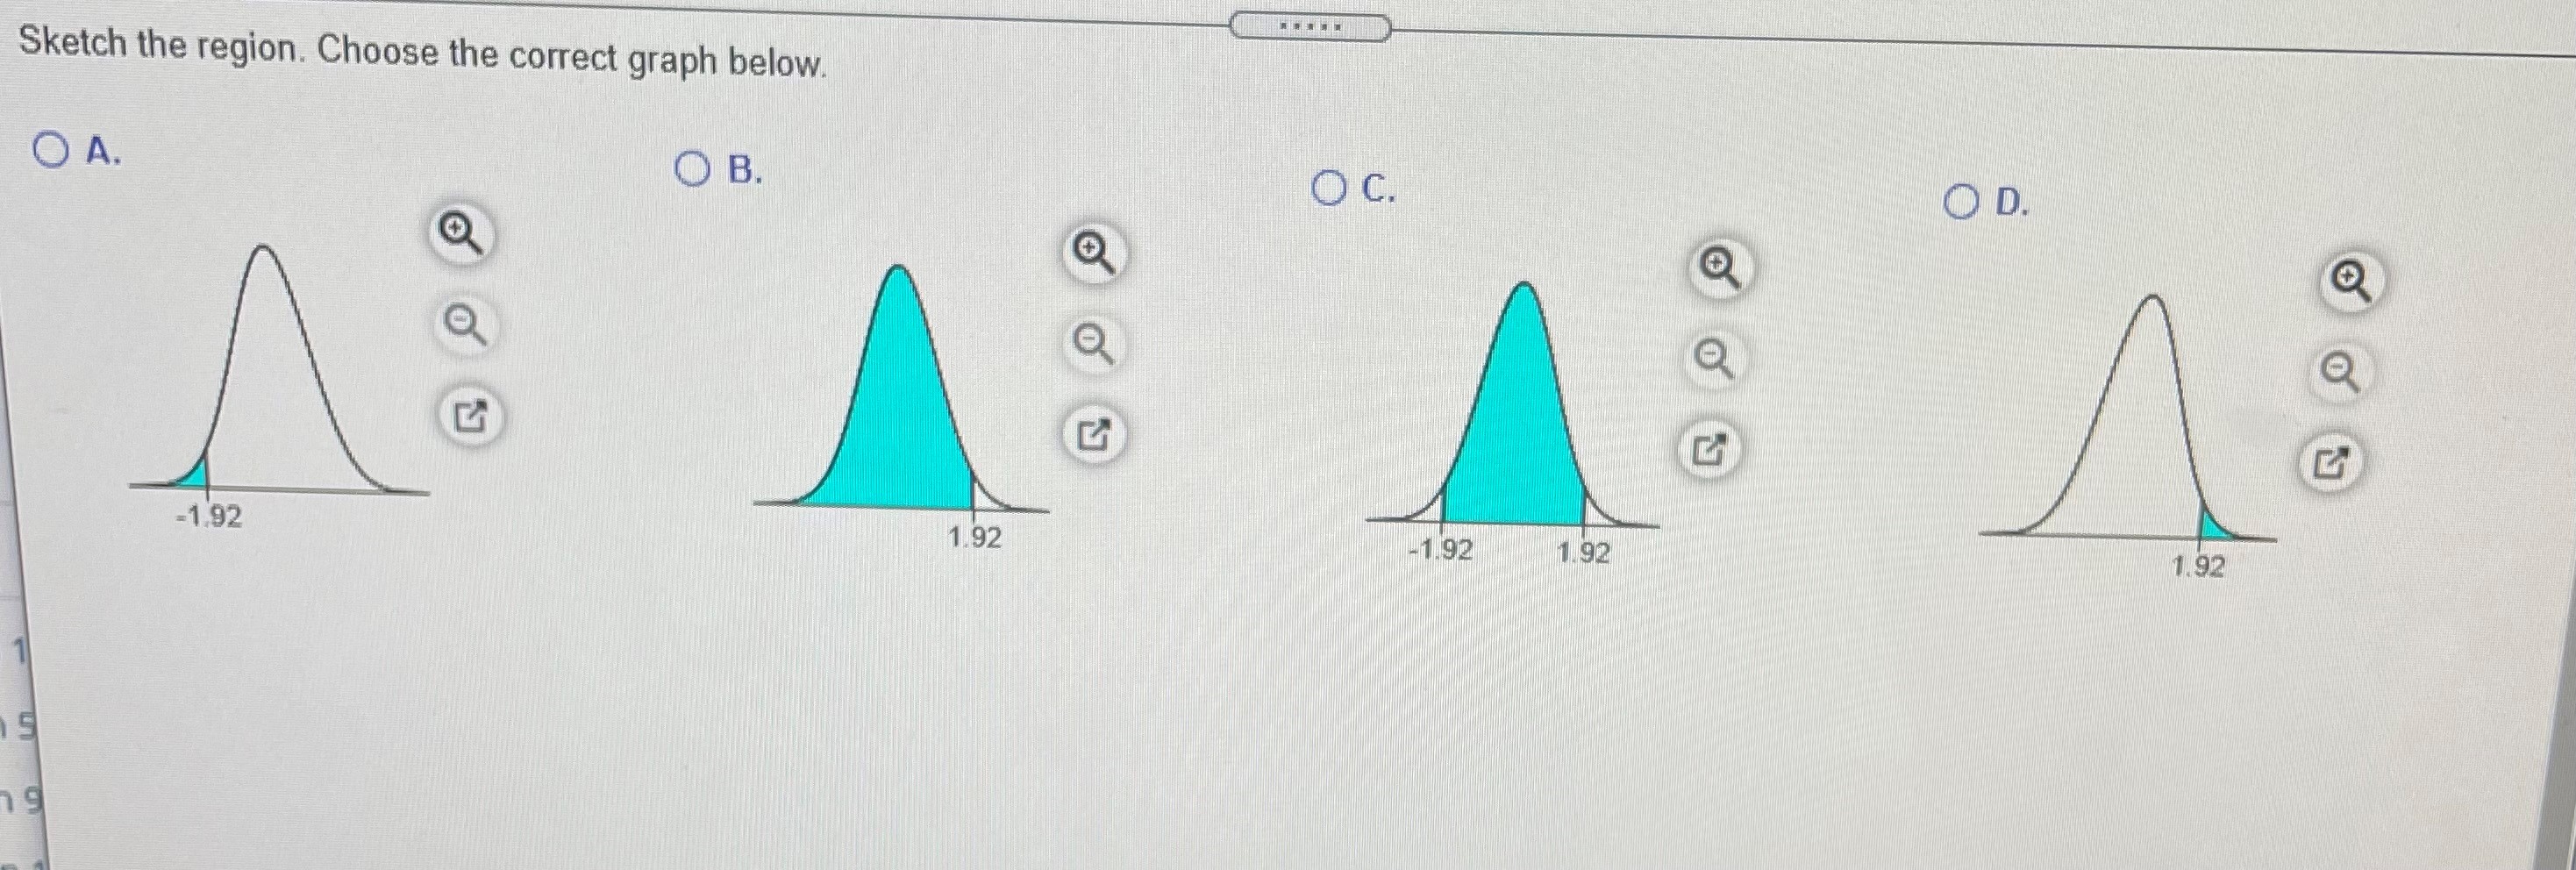

\f\f.. ... Which graph represents P14? Choose the correct graph below. OA. OB. O C. O D. X P 14 P 14 P14 P14Find the area of the shaded region. The graph depicts the standard normal distribution of bone density scores with mean 0 and standard deviation 1. O Z= -1.16 The area of the shaded region is (Round to four decimal places as needed.) n 1 on S on g ion tion 1 tion 2Find the indicated z score. The graph depicts the standard normal distribution with mean 0 and standard deviation 1. 0.2296 The indicated z score is (Round to two decimal places as needed.)Find the indicated z score. The graph depicts the standard normal distribution with mean 0 and standard deviation 1. O Q 0. 1314 The indicated z score is (Round to two decimal places as needed.)Sketch the region. Choose the correct graph below. OA. OB. O C. OD. O O -1.92 1.92 -1.92 1.92 1.92Sketch the region. Choose the correct graph below. O A. O B. O C. OD. En -1.55 1.55 1.55 -1 55 -1.55
Step by Step Solution
There are 3 Steps involved in it

Get step-by-step solutions from verified subject matter experts