

Question: SECTION 6.4 / USEFUL Lives Art EQUAL TO THE STUDY PERIOD 251 Spreadsheet Solution Figure 6-3 presents a spreadsheet solution for identifying the press that
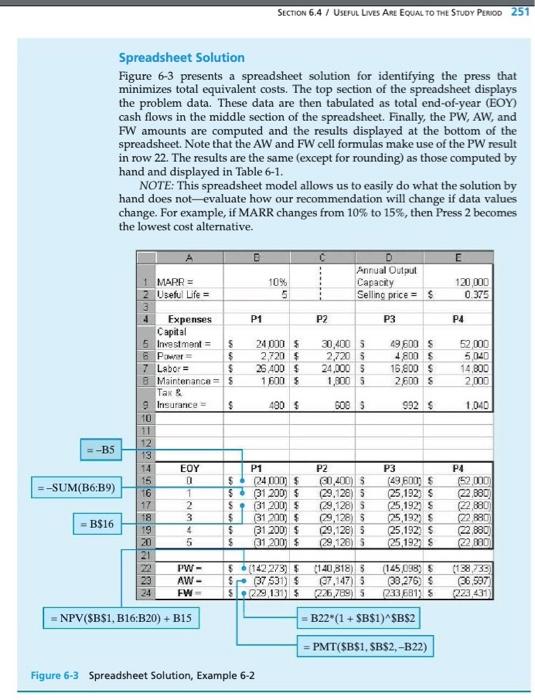
SECTION 6.4 / USEFUL Lives Art EQUAL TO THE STUDY PERIOD 251 Spreadsheet Solution Figure 6-3 presents a spreadsheet solution for identifying the press that minimizes total equivalent costs. The top section of the spreadsheet displays the problem data. These data are then tabulated as total end-of-year (EOY) cash flows in the middle section of the spreadsheet. Finally, the PW, AW, and FW amounts are computed and the results displayed at the bottom of the spreadsheet. Note that the AW and FW cell formulas make use of the PW result in row 22. The results are the same (except for rounding) as those computed by hand and displayed in Table 6-1. NOTE: This spreadsheet model allows us to easily do what the solution by hand does not-evaluate how our recommendation will change if data values change. For example, if MARR changes from 10% to 15%, then Press 2 becomes the lowest cost alternative. B C E 1 MARR Useful Life 10% 5 Annual Output Capacity Selling price = $ 120 000 0.375 H ON P1 P2 P3 P4 5 $ 24 000 $ 2720 26 400 $ 1600 $ 30,400 5 2,720 S 24.000 5 1,2005 49 600S 4800 $ 16.800 $ 2,600 s 52 000 5,040 14 800 2.00 $ 480 $ BOB S 992 $ 1,040 --BS 4 Expenses Capital 5 Investment 6 Power 7 Labor = 8 Maintenance Tax & 9 Insurance 10 11 12 13 14 EOY 15 0 16 1 17 2 18 3 19 20 5 21 PW- AW- 24 FW P1 P2 P3 =-SUM(B6:39) AWN-- $ (24 000 $ $31200) $ S 31 200) $ (31 2009 $ 31200 S $ 31 2005 0400) 3 (29.128) 5 (29.128) S 29,128) 3 (29,128) 3 (29,128) 5 (49.600) 25,192) $ (25,192) S 25,192) 25.192) S 25 1925 P4 (52 m 22,880 (22 880 (22 890 (22 880 22 290 B$16 5 (142273) $37 531) $ S. 2291313 (140 818) 3 (37,147) 225 789) (145,098) 33.276) S 1233681) (138,739 (36,597 223 431 NPV($B$1, B16:B20) + B15 =B22*(1 + $B$1) $B$2 PMT($B$1,$B$2,-B22) Figure 6-3. Spreadsheet Solution, Example 6-2 SECTION 6.4 / USEFUL Lives Art EQUAL TO THE STUDY PERIOD 251 Spreadsheet Solution Figure 6-3 presents a spreadsheet solution for identifying the press that minimizes total equivalent costs. The top section of the spreadsheet displays the problem data. These data are then tabulated as total end-of-year (EOY) cash flows in the middle section of the spreadsheet. Finally, the PW, AW, and FW amounts are computed and the results displayed at the bottom of the spreadsheet. Note that the AW and FW cell formulas make use of the PW result in row 22. The results are the same (except for rounding) as those computed by hand and displayed in Table 6-1. NOTE: This spreadsheet model allows us to easily do what the solution by hand does not-evaluate how our recommendation will change if data values change. For example, if MARR changes from 10% to 15%, then Press 2 becomes the lowest cost alternative. B C E 1 MARR Useful Life 10% 5 Annual Output Capacity Selling price = $ 120 000 0.375 H ON P1 P2 P3 P4 5 $ 24 000 $ 2720 26 400 $ 1600 $ 30,400 5 2,720 S 24.000 5 1,2005 49 600S 4800 $ 16.800 $ 2,600 s 52 000 5,040 14 800 2.00 $ 480 $ BOB S 992 $ 1,040 --BS 4 Expenses Capital 5 Investment 6 Power 7 Labor = 8 Maintenance Tax & 9 Insurance 10 11 12 13 14 EOY 15 0 16 1 17 2 18 3 19 20 5 21 PW- AW- 24 FW P1 P2 P3 =-SUM(B6:39) AWN-- $ (24 000 $ $31200) $ S 31 200) $ (31 2009 $ 31200 S $ 31 2005 0400) 3 (29.128) 5 (29.128) S 29,128) 3 (29,128) 3 (29,128) 5 (49.600) 25,192) $ (25,192) S 25,192) 25.192) S 25 1925 P4 (52 m 22,880 (22 880 (22 890 (22 880 22 290 B$16 5 (142273) $37 531) $ S. 2291313 (140 818) 3 (37,147) 225 789) (145,098) 33.276) S 1233681) (138,739 (36,597 223 431 NPV($B$1, B16:B20) + B15 =B22*(1 + $B$1) $B$2 PMT($B$1,$B$2,-B22) Figure 6-3. Spreadsheet Solution, Example 6-2
Step by Step Solution
There are 3 Steps involved in it

Get step-by-step solutions from verified subject matter experts