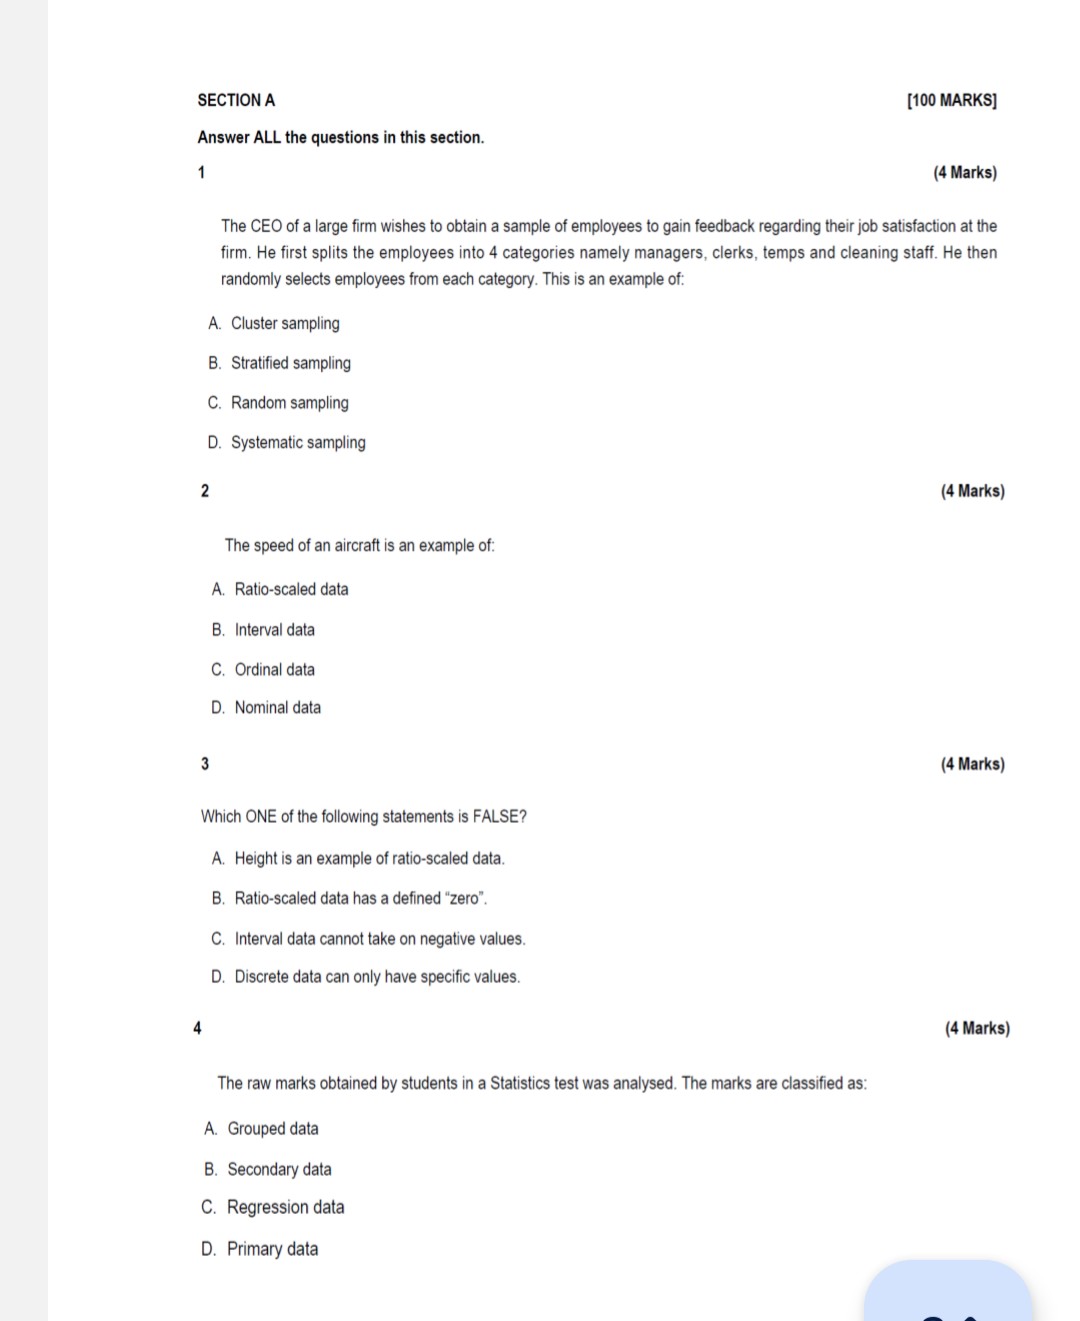
Question: SECTION A Answer ALL the questions in this section. 1 [100 MARKS) (4 Marks) The CEOQ of a large firm wishes to obtain a sample

SECTION A Answer ALL the questions in thisSECTION A Answer ALL the questions in thisSECTION A Answer ALL the questions in thisSECTION A Answer ALL the questions in this
SECTION A Answer ALL the questions in this section. 1 [100 MARKS) (4 Marks) The CEOQ of a large firm wishes to obtain a sample of employees to gain feedback regarding their job satisfaction at the firm. He first splits the employees into 4 categories namely managers, clerks, temps and cleaning staff. He then randomly selects employees from each category. This is an example of: A. Cluster sampling B. Stratified sampling C. Random sampling D. Systematic sampling 2 The speed of an aircraft is an example of: A. Ratio-scaled data B. Interval data C. Ordinal data D. Nominal data Which ONE of the following statements is FALSE? A. Height is an example of ratio-scaled data. B. Ratio-scaled data has a defined \"zero\". C. Interval data cannot take on negative values. D. Discrete data can only have specific values. The raw marks obtained by students in a Statistics test was analysed. The marks are classified as: A. Grouped data B. Secondary data C. Regression data D. Primary data (4 Marks) (4 Marks) (4 Marks) Refer to the data below. 82 46 20 32 54 The mean is: A. 55 B. 49 C. 53 D. 51 Refer to the data below. 82 46 20 32 54 The range is: A 36 B. 62 C. 50 D12 Refer to the data below. 82 46 20 32 54 The absolute difference between the mode and median is: AT B. 3 C 4 D. 2 42 42 42 78 78 78 (4 Marks) (4 Marks) (4 Marks) 8 (4 Marks) Which measure of dispersion in a data set is calculated using all the values in the set? A. Range B. Standard deviation C. Semi Interguartile Range D. Interquartile Range 9 (4 Marks) Another term for the 251 percentile is the: A. lower quartile B. median C. average D. upper quartile 10 (4 Marks) A data set has the following measures of central location: Mean = 66, Median = 59 and Mode = 54. The data is said to be: A. Skewed to the left B. Skewed to the right C. Symmetrical D. Linear 1 (4 Marks) Refer to the (incomplete) grouped frequency table data below which depicts the price (in R) of 45 grocery items. Price (R) Frequency f Midpoint (m) fm fm? Cumulative frequency 0.00

Step by Step Solution

There are 3 Steps involved in it

1 Expert Approved Answer
Step: 1 Unlock blur-text-image
Question Has Been Solved by an Expert!

Get step-by-step solutions from verified subject matter experts

Step: 2 Unlock
Step: 3 Unlock

Students Have Also Explored These Related Mathematics Questions!