

Question: Section A: Collect and compare data Is Sample A a typical Australian Year 9 class? QUESTION 1 QUESTION 3 Sample A - Fictitious Australian Year
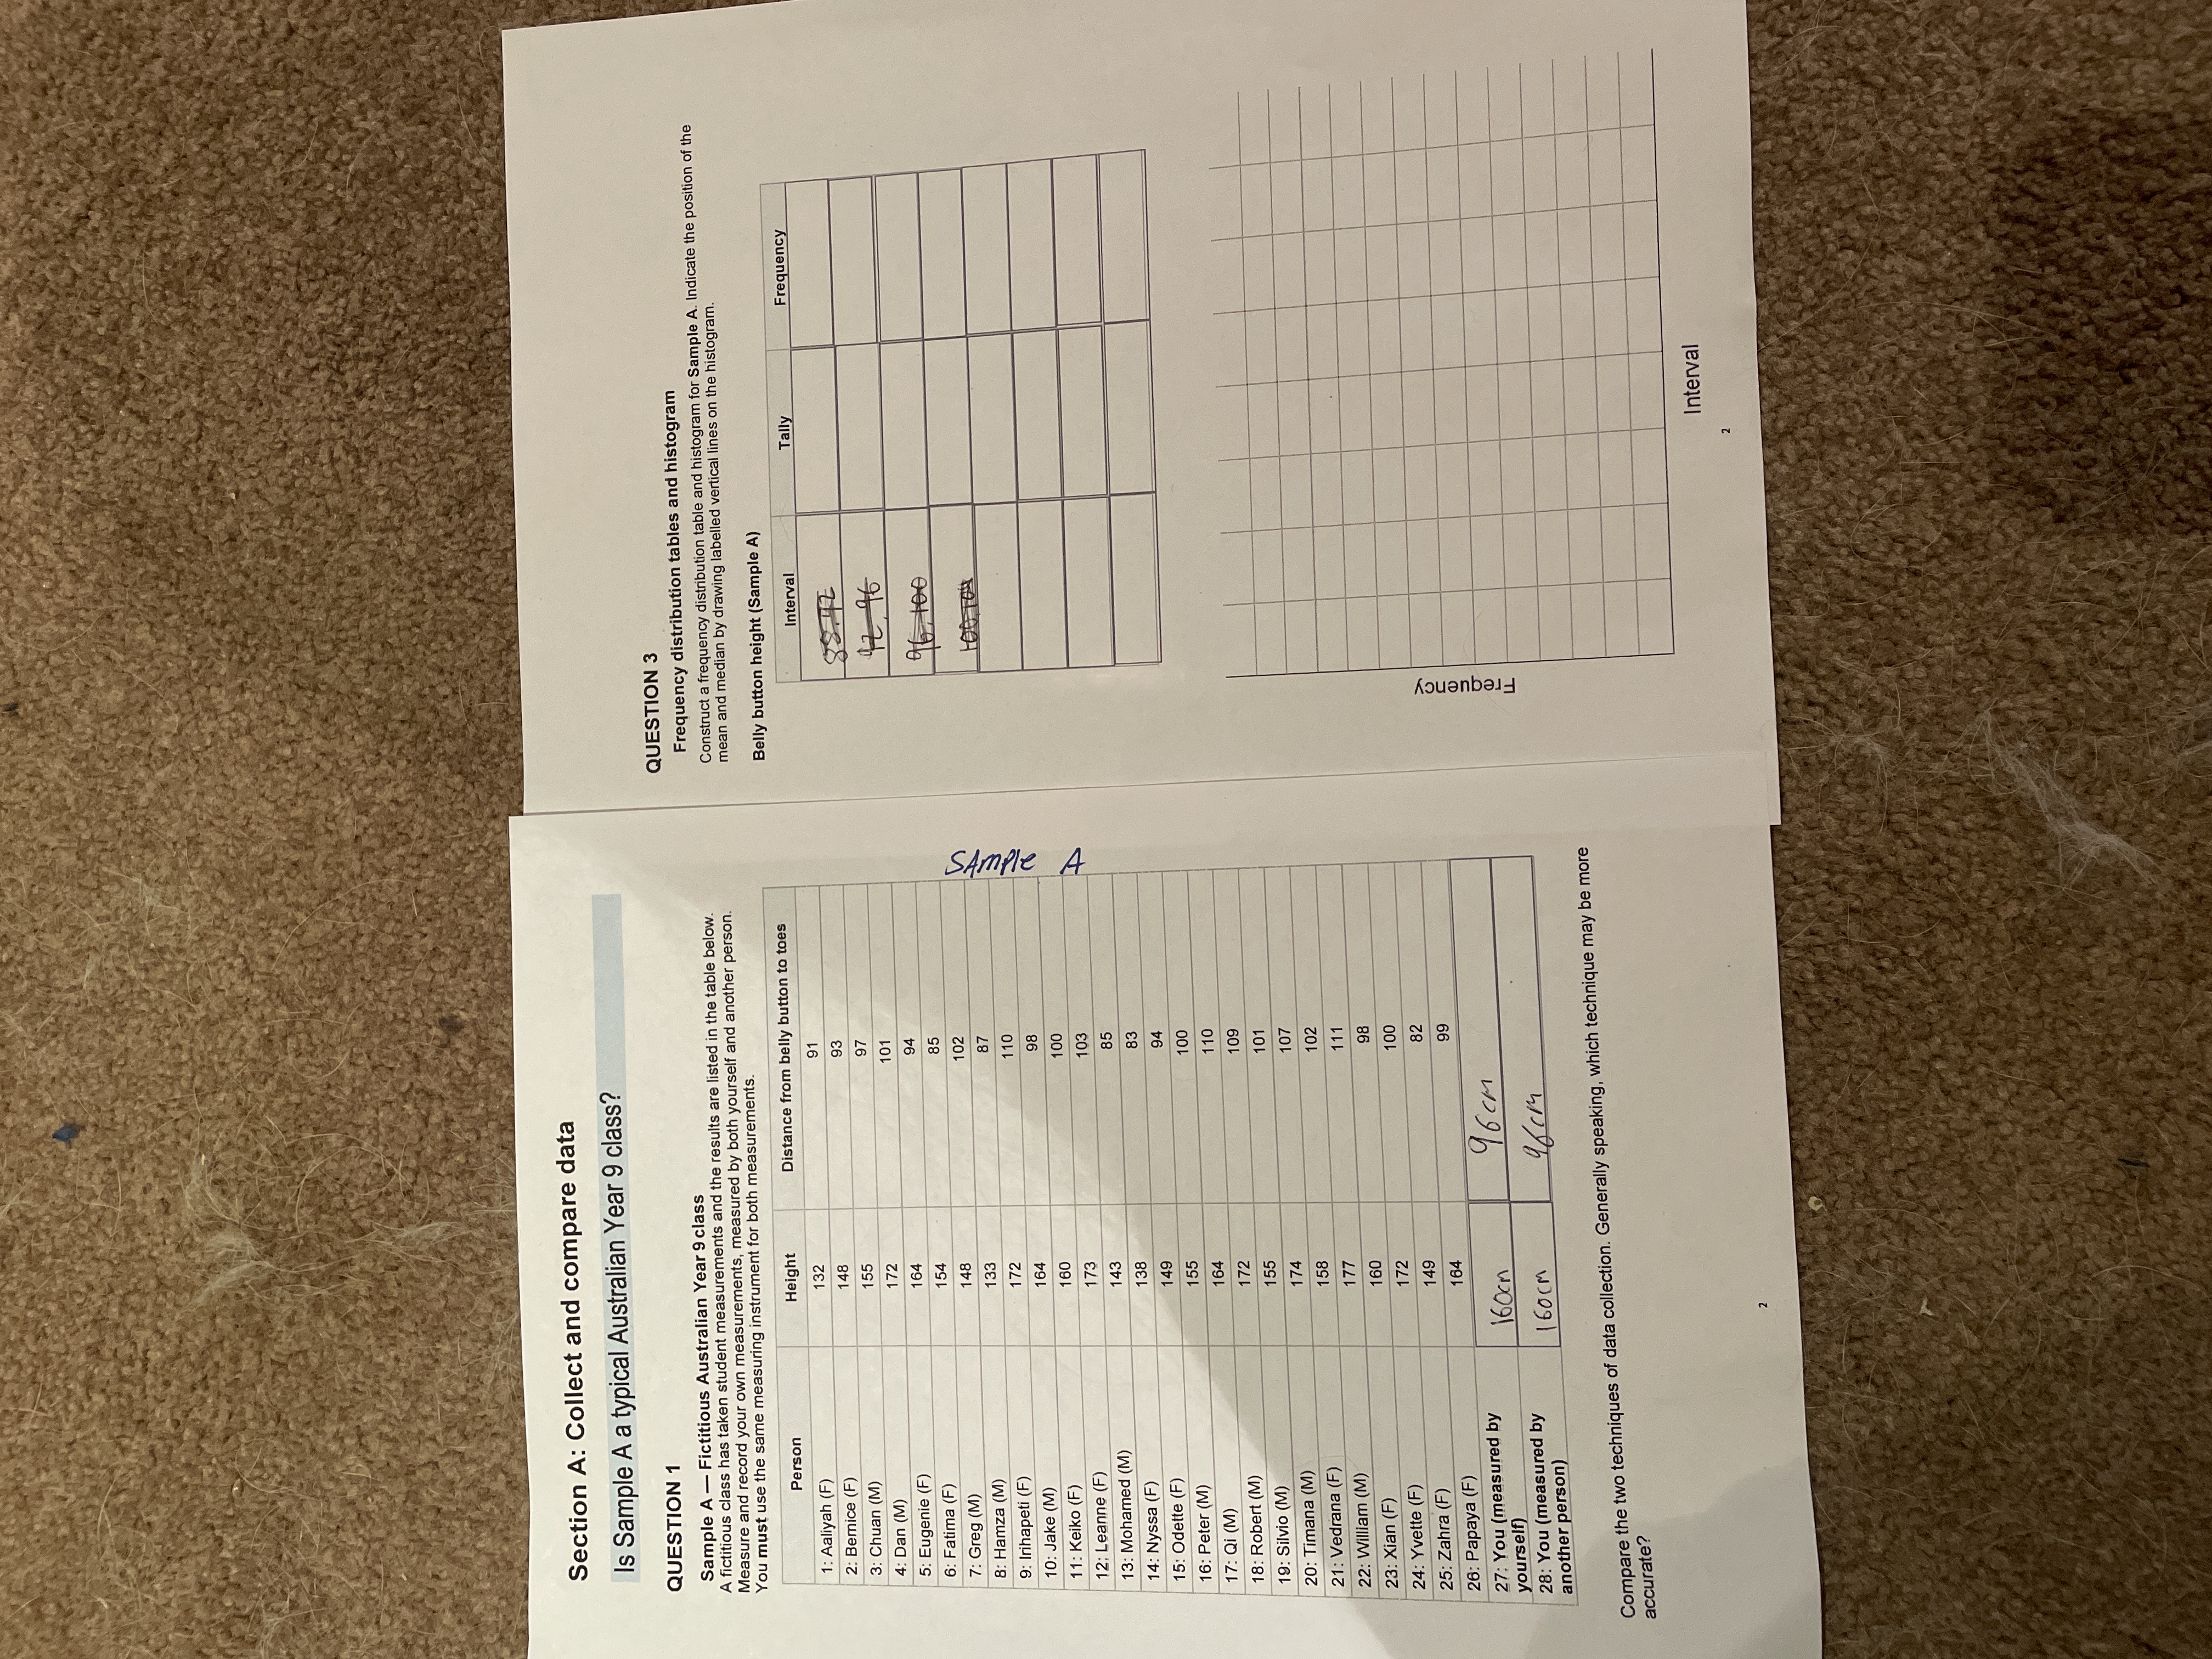
Section A: Collect and compare data Is Sample A a typical Australian Year 9 class? QUESTION 1 QUESTION 3 Sample A - Fictitious Australian Year 9 class Frequency distribution tables and histogram A fictitious class has taken student measurements and the results are listed in the table below. Measure and record your own measurements, measured by both yourself and another person. Construct a frequency distribution table and histogram for Sample A. Indicate the position of the You must use the same measuring instrument for both measurements. mean and median by drawing labelled vertical lines on the histogram. Person eigh Belly button height (Sample A) Distance from belly button to toes 1: Aaliyah (F) 132 91 Interval Tally Frequency 2: Bemice (F) 148 93 3: Chuan (M) 155 97 4: Dan (M) 172 101 42 46 5: Eugenie (F) 164 94 6: Fatima (F) 154 85 7: Greg (M) 148 102 8: Hamza (M) 133 87 9: Irinapeti (F) 172 110 164 SAmple A 10: Jake (M) 98 11: Keiko (F) 160 100 12: Leanne (F) 173 103 13: Mohamed (M) 143 85 14: Nyssa (F) 138 83 15: Odette (F) 149 94 16: Peter (M) 155 100 17: Qi (M) 164 110 18: Robert (M) 172 109 19: Silvio (M) 155 101 20: Timana (M) 174 107 21: Vedrana (F) 158 102 22: William (M) 177 111 23: Xian (F) 160 98 24: Yvette (F) 172 100 25: Zahra (F) 149 82 26: Papaya (F) 164 99 27: You (measured by 96 cm Frequency yourself) 160 cm 28: You (measured by another person) 160 (M 9/cm Compare the two techniques of data collection. Generally speaking, which technique may be more accurate? Interval
Step by Step Solution
There are 3 Steps involved in it

Get step-by-step solutions from verified subject matter experts