

Question: Section A The questions in this section are based on the work presented in Fetzer, T and Graeber T. (2020) Does contact tracing work? Quasi-experimental
Section A The questions in this section are based on the work presented in Fetzer, T and Graeber T. (2020) Does contact tracing work? Quasi-experimental evidence from an Excel error in England, CAGE Working Paper, no. 521. You were asked to read this paper before this examination. Relevant tables are reproduced in the Appendix.
1. Briefly describe the circumstances which allowed the authors to consider a difference-indifference research design to answer the question of whether contract tracing works. [No technical language, max 150 words.] [5 MARKS]
2. Explain how the authors derive a regional intensity of treatment variable. The authors present a number of variations and you can chose which one you describe. [Your verbal argument can be supported by sketches, max 400 words.] [20 MARKS]
3. Refer to the results in Table 2 and Figure 2. Interpret, qualitatively, the yellow highlighted values in Table 2. Also discuss what additional information you can draw from the results presented in Figure 2. [Max 200 words.] [10 MARKS]
4. Recently the UKs Track and Trace system has come under criticism, see for instance https://www.bbc.comews/health-56340831. In the article, Committee chairwoman Meg Hillier said it was hard to point to a measurable difference the test-and-trace system had made. Do the results of the Fetzer and Graeber paper contribute to this claim? [Max 300 words.] [15 MARKS]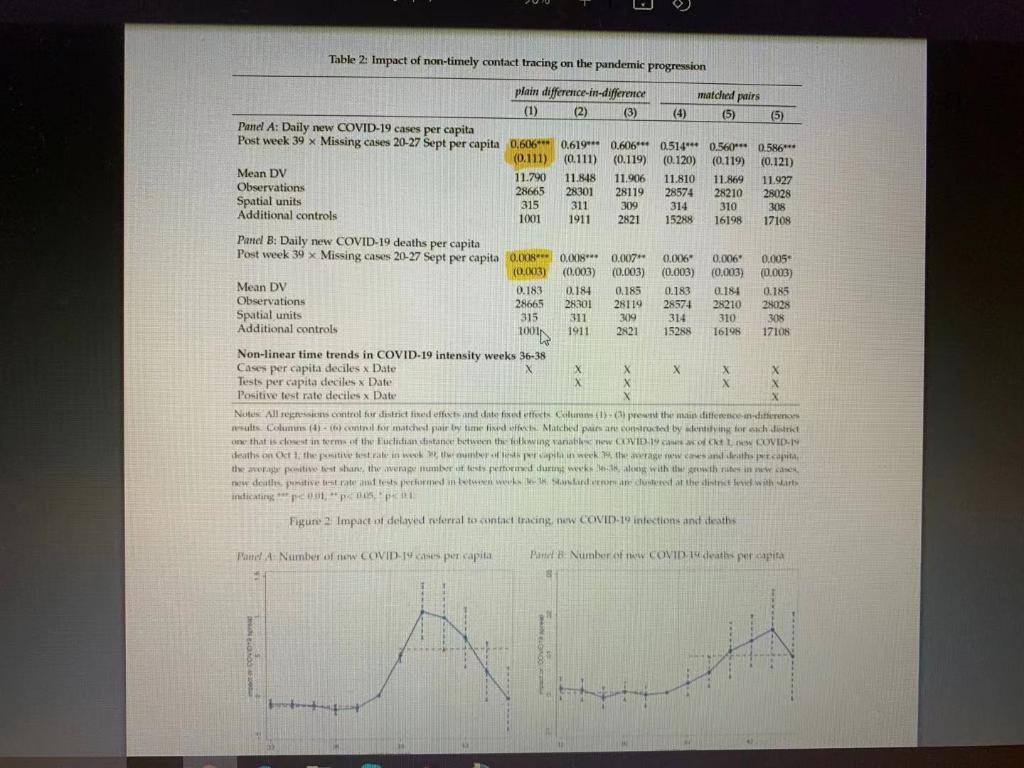
Table 2: Impact of non-timely contact tracing on the pandemic progression plain difference-in-difference matched pairs (1) (2) (3) (4) (5) (5) Pand A: Daily new COVID-19 cases per capita Post week 39 x Missing cases 20-27 Sept per capita 0.606*** 0.619** 0.606** 0.514*** 0.560*** 0.586*** (0.111) (0.111) (0.119) (0.120) (0.119) (0.121) Mean DV 11.790 11.848 11.906 11.810 11.869 11.927 Observations 28665 28301 28119 28574 28210 28028 Spatial units 315 311 309 314 310 308 Additional controls 1001 1911 2821 15288 16198 17108 Panel B: Daily new COVID-19 deaths per capita Post week 39 x Missing cases 20-27 Sept per capita 0.008 0.008*** 0.007 0.006 0.006 0.005 (0.003) (0.003) (0.003) (0.003) (0.003) (0.003) Mean DV 0.183 0.184 0.185 0.183 0.184 0.185 Observations 28665 28301 28119 28574 28210 28028 Spatial units 315 311 309 314 310 308 Additional controls 1001N 1911 2821 15288 16198 17105 Non-linear time trends in COVID-19 intensity weeks 36-38 Cases per capita deciles x Date X X X X X Tests per capita deciles Date X X X Positive test rate deciles x Date X X Nutus All regression control for districted effects and date fixatetec Count)-(prown the main diferencou-dition results Columns (4) control for matched pair by time lied Matched pues are constructed by wentutying for each do one that is closest in terms of the Euclidian distance between the towing variable new CVI 19 wordt COVID:19 deaths on Oct 1, the petite testate in complete was well as precapita the patients han the werage libertats performed during week... along with the other new sex new death antive tetrades performed in between werk te Sanitardomare cu teret of the district lood with art indicating, pc Figure 2 Impactant delayed referral to contact tracing, new COVID-19 infections and deaths Pand. Number of new COVID-19 per capita Panel Number of COVID. 14 deaths per capita Table 2: Impact of non-timely contact tracing on the pandemic progression plain difference-in-difference matched pairs (1) (2) (3) (4) (5) (5) Pand A: Daily new COVID-19 cases per capita Post week 39 x Missing cases 20-27 Sept per capita 0.606*** 0.619** 0.606** 0.514*** 0.560*** 0.586*** (0.111) (0.111) (0.119) (0.120) (0.119) (0.121) Mean DV 11.790 11.848 11.906 11.810 11.869 11.927 Observations 28665 28301 28119 28574 28210 28028 Spatial units 315 311 309 314 310 308 Additional controls 1001 1911 2821 15288 16198 17108 Panel B: Daily new COVID-19 deaths per capita Post week 39 x Missing cases 20-27 Sept per capita 0.008 0.008*** 0.007 0.006 0.006 0.005 (0.003) (0.003) (0.003) (0.003) (0.003) (0.003) Mean DV 0.183 0.184 0.185 0.183 0.184 0.185 Observations 28665 28301 28119 28574 28210 28028 Spatial units 315 311 309 314 310 308 Additional controls 1001N 1911 2821 15288 16198 17105 Non-linear time trends in COVID-19 intensity weeks 36-38 Cases per capita deciles x Date X X X X X Tests per capita deciles Date X X X Positive test rate deciles x Date X X Nutus All regression control for districted effects and date fixatetec Count)-(prown the main diferencou-dition results Columns (4) control for matched pair by time lied Matched pues are constructed by wentutying for each do one that is closest in terms of the Euclidian distance between the towing variable new CVI 19 wordt COVID:19 deaths on Oct 1, the petite testate in complete was well as precapita the patients han the werage libertats performed during week... along with the other new sex new death antive tetrades performed in between werk te Sanitardomare cu teret of the district lood with art indicating, pc Figure 2 Impactant delayed referral to contact tracing, new COVID-19 infections and deaths Pand. Number of new COVID-19 per capita Panel Number of COVID. 14 deaths per capita
Step by Step Solution
There are 3 Steps involved in it

Get step-by-step solutions from verified subject matter experts