

Question: SECTION B: CASE STUDY: ANALYTICAL METHOD VALIDATION (25 points total) Your lead research scientist Dr. Welby, PhD (he reminds you of his PhDs in Biology,
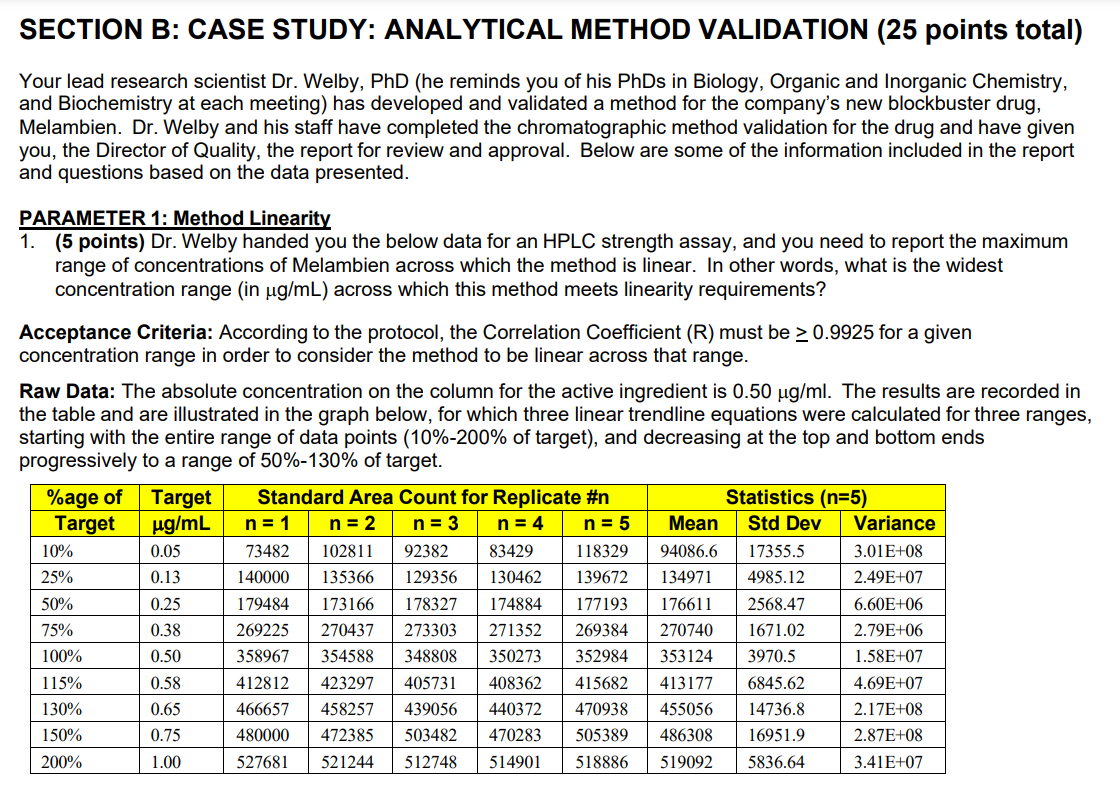
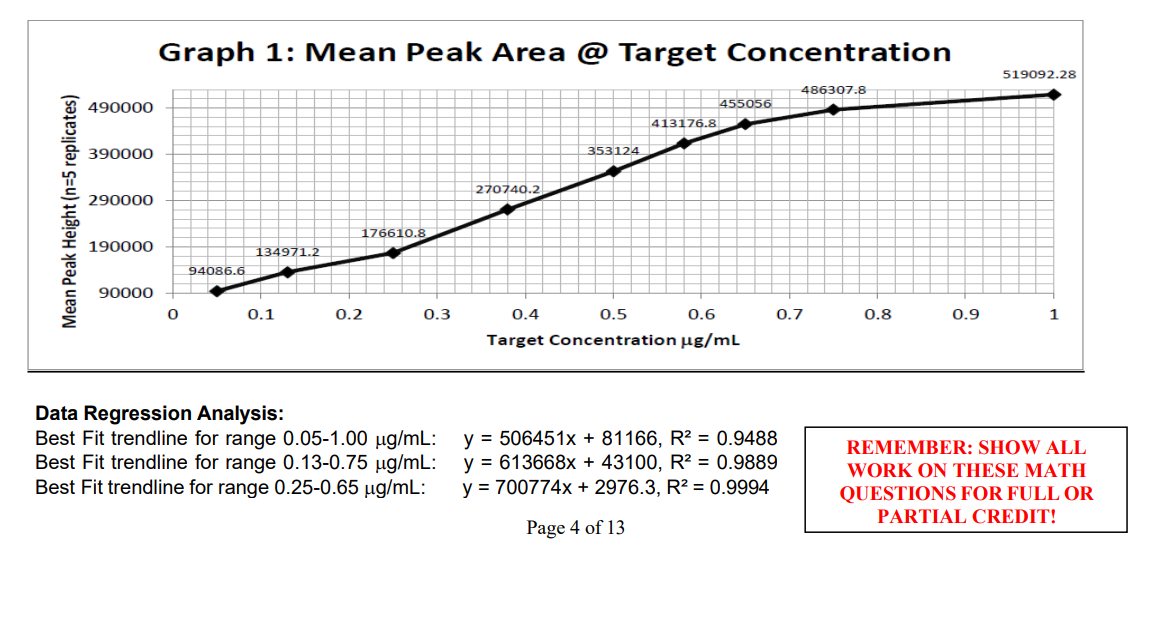
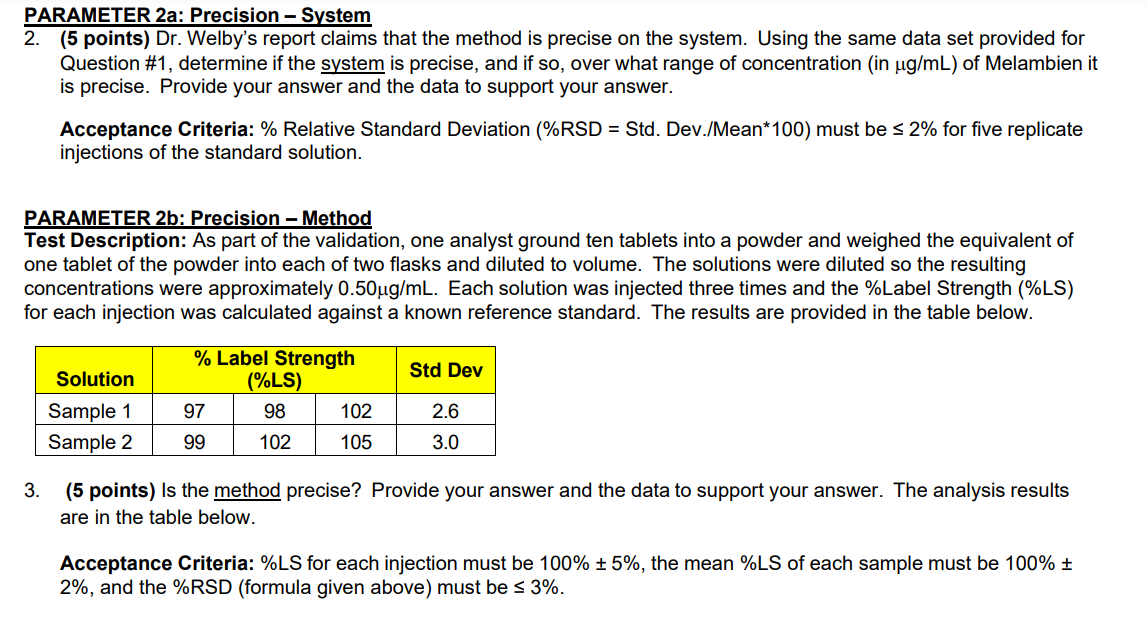
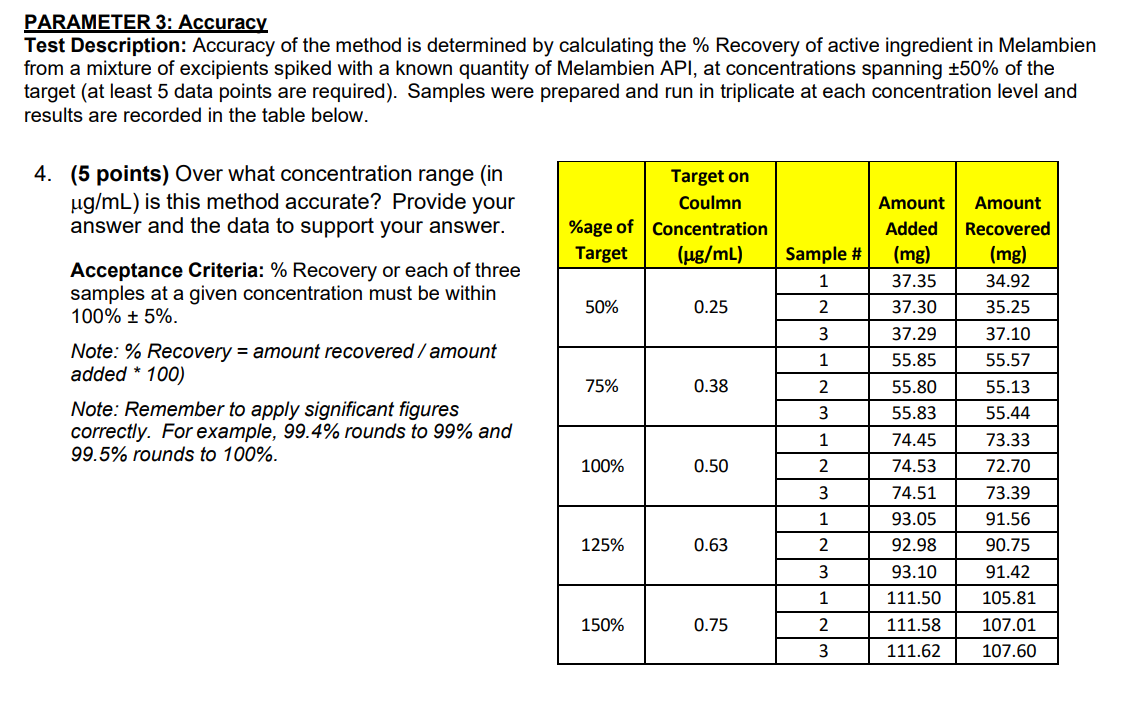
SECTION B: CASE STUDY: ANALYTICAL METHOD VALIDATION (25 points total) Your lead research scientist Dr. Welby, PhD (he reminds you of his PhDs in Biology, Organic and Inorganic Chemistry, and Biochemistry at each meeting) has developed and validated a method for the company's new blockbuster drug, lvlelambien. Dr. Welby and his staff have completed the chromatographic method validation for the drug and have given you, the Director of Quality, the report for review and approval. Below are some of the information included in the report and questions based on the data presented. PARAMETER 1: Method Linearity 1. (5 points) Dr. Welby handed you the below data for an HPLC strength assay, and you need to report the maximum range of concentrations of lvlelambien across which the method is linear. In other words, what is the widest concentration range (in uglmL) across which this method meets linearity requirements? Acceptance Criteria: According to the protocol, the Correlation Coefcient (R) must be a 0.9925 for a given concentration range in order to consider the method to be linear across that range. Raw Data: The absolute concentration on the column for the active ingredient is 0.50 pglml. The results are recorded in the table and are illustrated in the graph below, for which three linear trendline equations were calculated for three ranges, starting with the entire range of data points (10%-200% of target), and decreasing at the top and bottom ends progressively to a range of 50%-130% of target. %age of Target Standard Area Count for Replicate #n Statistics (n=5} Target uglmL n = 1 n = 2 n = 3 n = 4 n = 5 Mean Std Dev Variance 10% 0.05 73482 102811 92382 83429 1 18329 94086.6 17355.5 3.01E08 25% 0.13 140000 13 5366 1293 56 130462 139672 134971 4985.12 2.49E07 50% 0.25 179484 173166 178327 174884 177193 17661 1 2568.47 6.60E06 75% 0.38 269225 270437 273303 271352 269384 270740 1671.02 2.79E06 100% 0.50 358967 354588 348808 350273 352984 353124 3970.5 1.58E07 115% 0.58 412812 423297 405731 408362 415682 413177 6845.62 4.69E07 130% 0 .65 466657 45 8257 439056 440372 470938 455056 14736.8 2.1 7E+08 150% 0.75 480000 472385 503482 470283 505389 486308 16951.9 2.87E08 200% 1.00 527681 521244 512748 514901 518886 519092 5836.64 3.41E07 Graph 1: Mean Peak Area @ Target Concentration 519092.28 486307.8 490000 455056 413176.8 390000 353124 270740.2 290000 Mean Peak Height (n=5 replicates) 176610.8 190000 134971.2 94086.6 90000 0 0.1 0.2 0.3 0.4 0.5 0.6 0.7 0.8 0.9 1 Target Concentration ug/ml Data Regression Analysis: Best Fit trendline for range 0.05-1.00 ug/ml: y = 506451x + 81166, R2 = 0.9488 REMEMBER: SHOW ALL Best Fit trendline for range 0.13-0.75 ug/ml: y = 613668x + 43100, R2 = 0.9889 WORK ON THESE MATH Best Fit trendline for range 0.25-0.65 ug/ml: y = 700774x + 2976.3, R2 = 0.9994 QUESTIONS FOR FULL OR Page 4 of 13 PARTIAL CREDIT!PARAMETER 2a: Precision System 2. (5 points) Dr. Welby's report claims that the method is precise on the system. Using the same data set provided for Question #1, determine if the system is precise, and if so, over what range of concentration (in pgl'mL) of Melambien it is precise. Provide your answer and the data to support your answer. Acceptance Criteria: % Relative Standard Deviation (%RSD = Std. Dev.l'Mean*100) must be 3 2% for ve replicate injections of the standard solution. PARAMETER 2b: Precision - Method Test Description: As part of the validation, one analyst ground ten tablets into a powder and weighed the equivalent of one tablet of the powder into each of two flasks and diluted to volume. The solutions were diluted so the resulting concentrations were approximately 0.50pgme. Each solution was injected three times and the %Label Strength (%LS) for each injection was calculated against a known reference standard. The results are provided in the table below. % Label Strength Solution (%le Std \"9" Sample 1 97 99 102 2.0 Sample 2 99 102 105 3.0 3. (5 points) Is the method precise? Provide your answer and the data to support your answer. The analysis results are in the table below. Acceptance Criteria: %LS for each injection must be 100% j: 5%, the mean %LS of each sample must be 100% i 2%, and the %RSD (formula given above) must be 3 3%. PARAMETER 3: Accuracy Test Description: Accuracy of the method is determined by calculating the % Recovery of active ingredient in Melambien from a mixture of excipients spiked with a known quantity of Melambien API, at concentrations spanning $5094: of the target (at least 5 data points are required). Samples were prepared and run in triplicate at each concentration level and results are recorded in the table below. 4. (5 points) Over what concentration range (in Target on ugme) is this method accurate? Provide your Coulmn Amount Amount answer and the data to support your answer. %age of Concentration Added Recovered Acceptance Criteria: % Recovery or each ofthree Target {pg/mt] Sample # (mg) [mg] samples at a given concentration must be within woman . Note: \"/3 Recovery = amount recovered/ amount me\" mo) - Note: Remember to appiy significant gures correctly. For exampie, 99.4% rounds to 99% and 99.5%: rounds to 100%
Step by Step Solution
There are 3 Steps involved in it

Get step-by-step solutions from verified subject matter experts