

Question: Section C: Capsim Advanced Forecasting (10 marks) Refer to the FastTrack posted in the Finance & Forecasting Assignment tab on the course website. Assume you
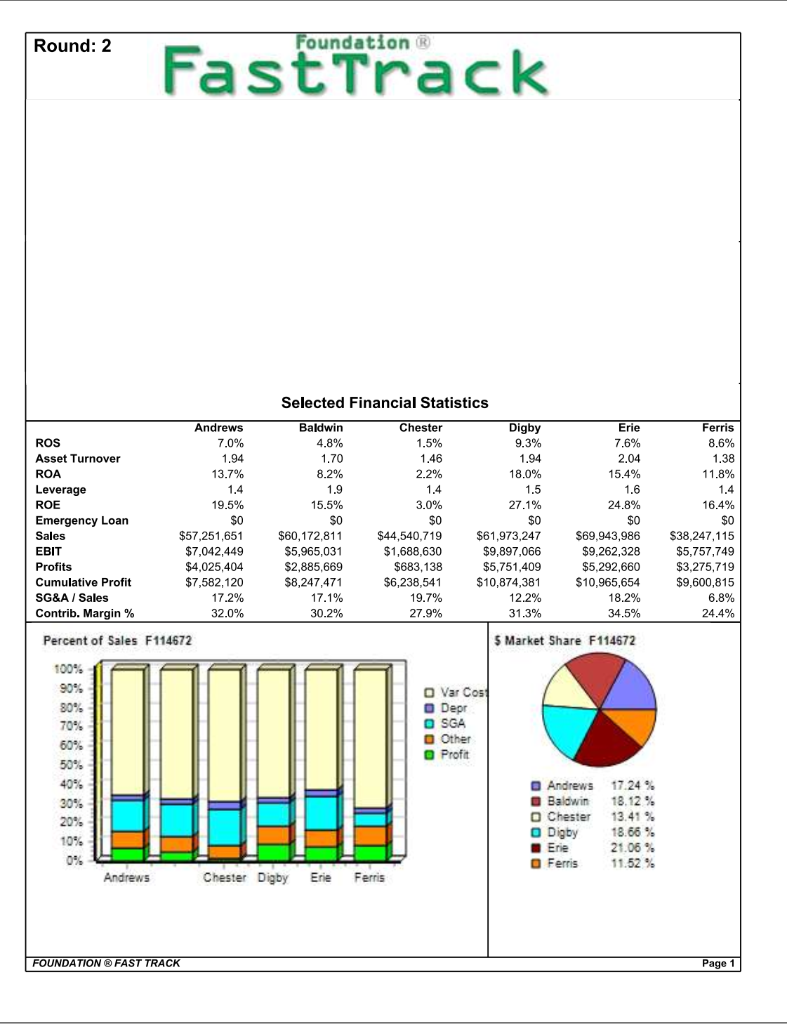
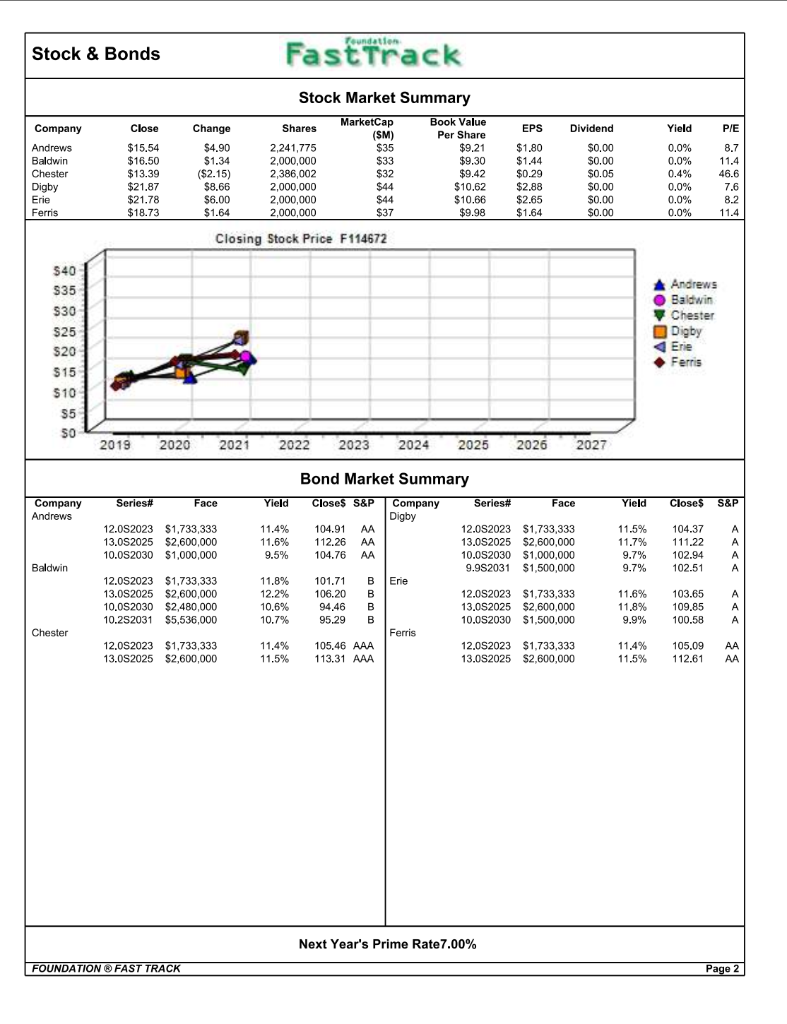
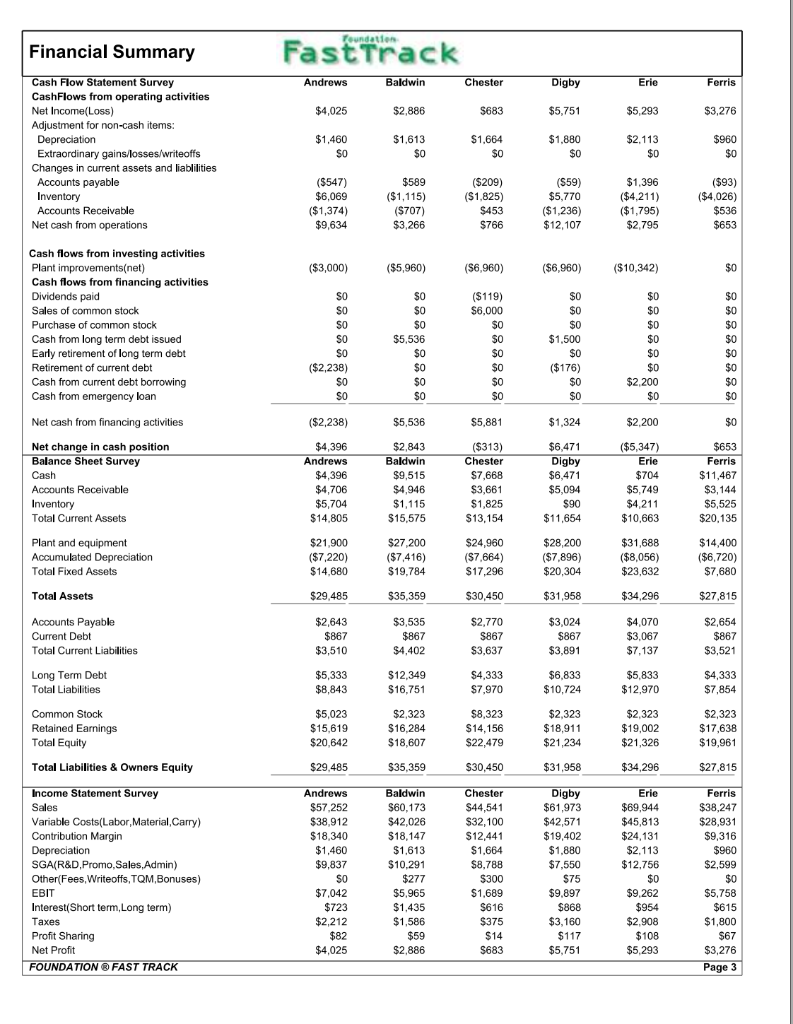
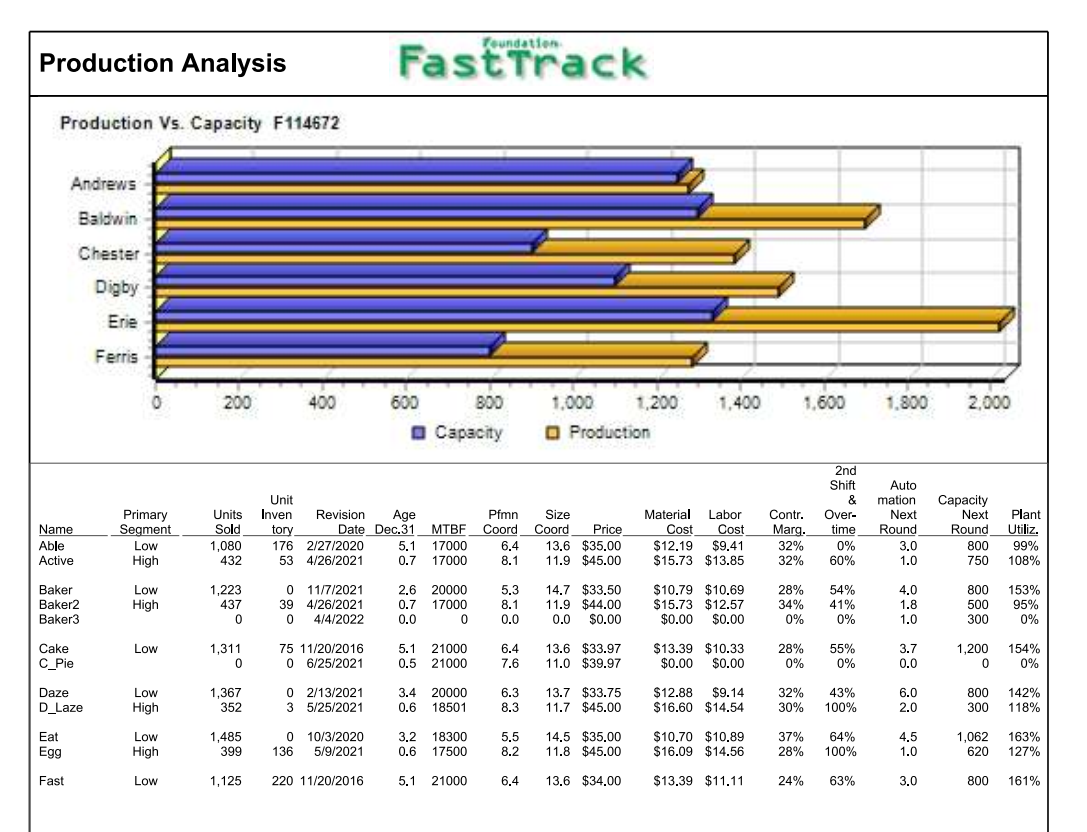
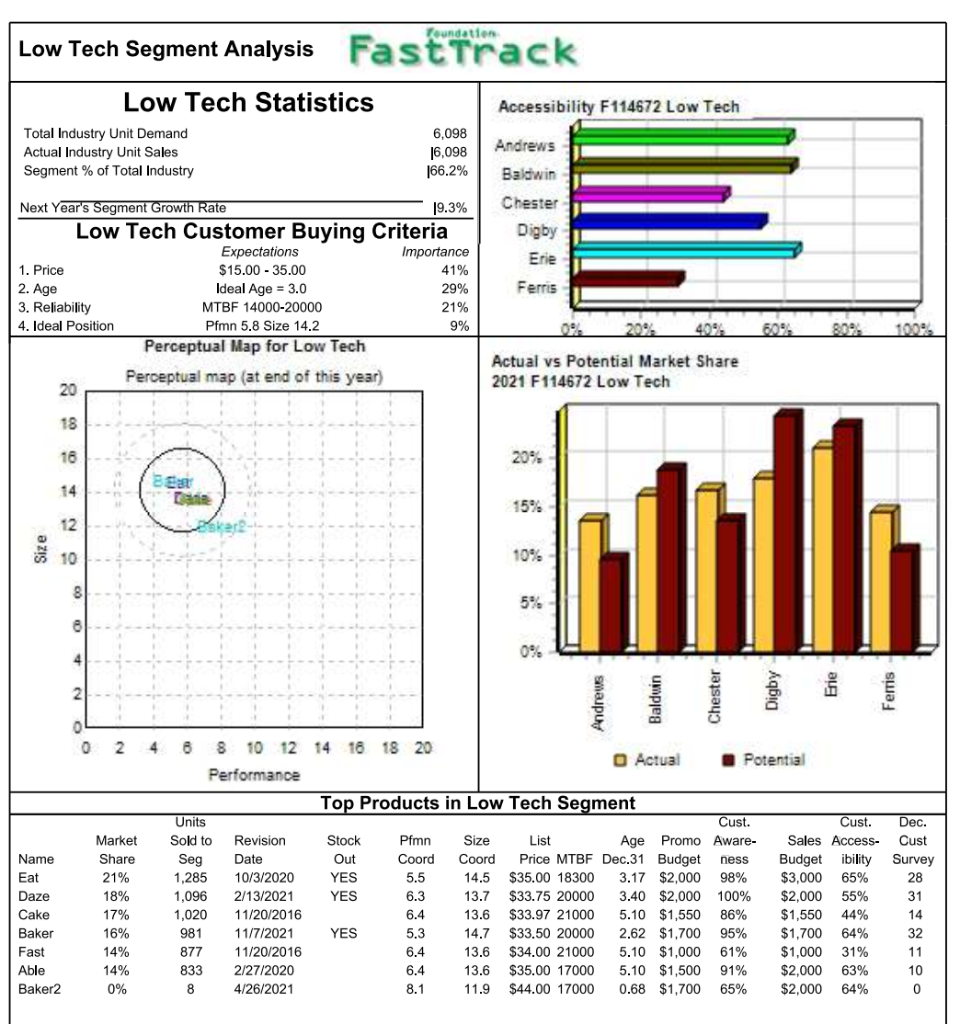
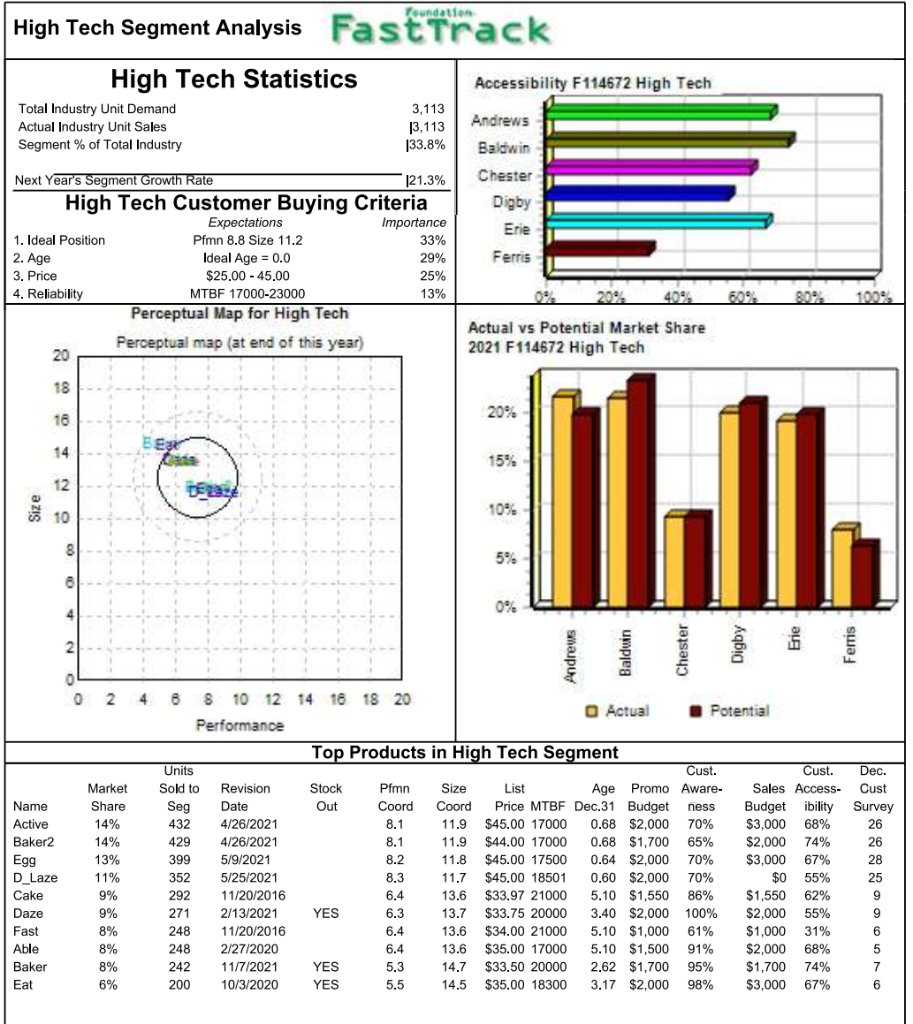
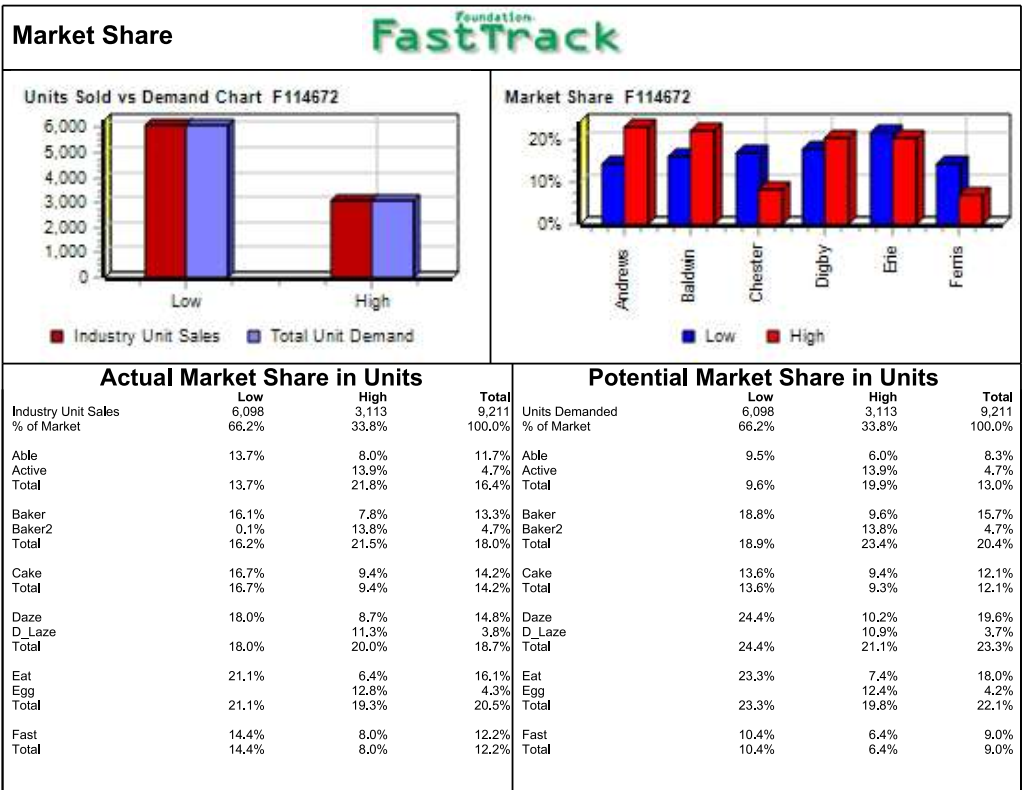
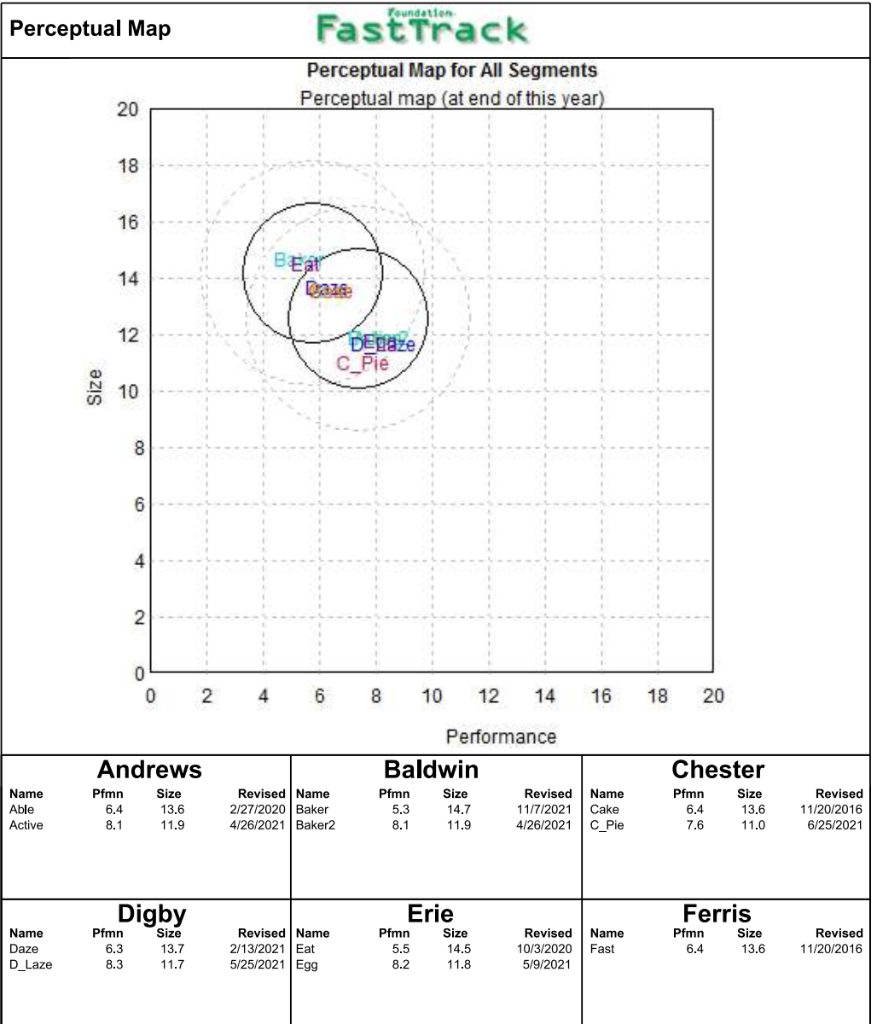
Section C: Capsim Advanced Forecasting (10 marks) Refer to the FastTrack posted in the Finance & Forecasting Assignment tab on the course website. Assume you are part of Team Digby and are responsible for making forecasting decisions for its product, D_Laze. You are forecasting for Round 3. Please answer the following questions. a) Identify the primary segment of the product at the end of Round 2. What was the total industry unit demand for this segment in Round 2? What will be the total demand for the segment in Round 3? (2 marks) b) Using the advanced forecasting method only, what is the worst-case market share that the product should achieve in Round 3? Calculate the worst-case demand in units for Round 3 using this market share. (4 marks) c) Are there any factors that make you believe that the worst-case market share calculated in step 2 is too low, or too high? Identify at least two factors which may have an impact and explain if each factor should increase or decrease the worst-case market share (you do not need to specify by how much). (4 marks) Round: 2 Foundation FastTrack Selected Financial Statistics Chester 1.5% 1.46 2.2% 1.4 3.0% Andrews 7.0% 1.94 13.7% 1.4 19.5% $0 $57,251,651 $7,042,449 $4,025,404 $7,582,120 17.2% 32.0% ROS Asset Turnover ROA Leverage ROE Emergency Loan Sales EBIT Profits Cumulative Profit SG&A / Sales Contrib. Margin % Baldwin 4.8% 1.70 8.2% 1.9 15.5% $O $60,172,811 $5,965,031 $2,885,669 $8,247,471 17.1% 30.2% % SO Digby 9.3% 1.94 18.0% 1.5 27.1% $0 $61,973,247 $9,897,066 $5,751,409 $10,874,381 12.2% 31.3% Erie 7.6% 2.04 15.4% 1.6 24.8% $0 $69,943,986 $9,262,328 $5,292,660 $10,965,654 18.2% 34.5% Ferris 8.6% 1.38 11.8% 1.4 16.4% $0 $38,247,115 $5,757,749 $3,275,719 $9,600,815 6.8% 24.4% $44,540,719 600 $1,688,630 $683,138 $6,238,541 19.7% 27.9% Percent of Sales F114672 S Market Share F114672 100% 90% 80% 70% 60% 50% 40% 30% 20% 10% Var Cost Depr O SGA Other Profit O Andrews 17.24% Baldwin 18.12% Chester 13.41 % Digby 18.66 % Erie 21.06% Ferris 11.52 % Andrews Chester Digby Erie Ferris FOUNDATION FAST TRACK Page 1 Stock & Bonds Fast Track Change PIE Company Andrews Baldwin Chester Digby Erie Ferris $9.30 Close $15.54 $16.50 $13.39 $21.87 $21.78 $18.73 Stock Market Summary MarketCap Book Value Shares (SM) Per Share 2,241,775 $35 $9,21 2,000,000 $33 2,386,002 $32 $9.42 2,000,000 $44 $10.62 2,000,000 $44 $10.66 2,000,000 $37 $9.98 $4.90 $1.34 ($2.15) $8.66 $6.00 $1.64 EPS $1,80 $1.44 $0.29 $2.88 $2.65 $1.64 Dividend $0.00 $0.00 $0.05 $0.00 $0.00 $0.00 Yield 0.0% 0.0% 0.4% 0.0% 0.0% 0.0% 8.7 11.4 46.6 7.6 8.2 11.4 Closing Stock Price F114672 $40 S35 S30 $25 $20 S15 $10 S5 SO Andrews Baldwin Chester Digby Erie Ferris 2019 2020 2021 2022 2023 2024 2025 2026 2027 Series# Company Andrews Face Yield Yield Close$ S&P P 12.0S2023 $1,733,333 13.0S2025 $2,600,000 10.082030 $1,000,000 11.4% 11.6% 9.5% Bond Market Summary Closes S&P Company Series# Face Digby 104.91 AA 12.0S2023 $1,733,333 112.26 AA 13.0S2025 $2,600,000 104.76 AA 10.052030 $1,000,000 9.9S2031 $1,500,000 101.71 B Erie 106.20 B 12.052023 $1,733,333 94.46 B 13.0S2025 $2,600,000 95.29 B 10.052030 $1,500,000 Ferris 105.46 AAA 12.0S2023 $1,733,333 113.31 AAA 13.0S2025 $2,600,000 11.5% 11.7% 9.7% 9.7% 104.37 111.22 102.94 102.51 A A A A Baldwin 12.0S2023 $1,733,333 13.0S2025 $2,600,000 10.082030 $2,480,000 10.252031 $5,536,000 11.8% 12.2% 10.6% 10.7% 11.6% 11.8% 9.9% 103.65 109.85 100.58 A Chester 12.0S2023 $1,733,333 13.0S2025 $2,600,000 11,4% 11.5% 11.4% 11.5% 105.09 112.61 AA AA Next Year's Prime Rate 7.00% FOUNDATION FAST TRACK Page 2 Foundation Financial Summary Andrews Baldwin Chester Digby Erie Ferris $4,025 $2,886 $683 $5,751 $5,293 $3,276 Cash Flow Statement Survey CashFlows from operating activities Net Income (Loss) Adjustment for non-cash items: Depreciation Extraordinary gains/losses/writeoffs Changes in current assets and liablilities Accounts payable Inventory Accounts Receivable Net cash from operations $1,460 SO $1,613 $0 $1,664 $0 $1,880 $0 $2,113 $0 $960 $0 ($547) $6,069 ($1,374) $9,634 $589 ($1,115) ($707) $3,266 ( ($209) ($1,825) $453 $766 ($59 $5,770 ($1,236 $12,107 $1,396 ($4,211) ($1,795) $2,795 ($93) ($4,026) $536 $653 ($3,000) ($5,960) ($6,960) ($6,960) ($10,342) Cash flows from investing activities Plant improvements(net) Cash flows from financing activities Dividends paid Sales of common stock Purchase of common stock Cash from long term debt issued Early retirement of long term debt Retirement of current debt Cash from current debt borrowing Cash from emergency loan SO SO SO SO SO ($2,238) SO SO SO $0 $0 $5,536 $o $0 $0 $0 ($119) $6,000 SO SO $o $0 $0 $0 $0 $0 $0 $1,500 $0 $ ($176) $0 $0 $0 $0 $0 $0 $0 $0 $2,200 $0 Net cash from financing activities ($2,238) $5,536 $5,881 $1,324 $2,200 $11,467 Net change in cash position Balance Sheet Survey Cash Accounts Receivable Inventory Total Current Assets $4,396 Andrews $4,396 $4,706 $5,704 $14,805 $2,843 Baldwin $9,515 $4,946 $1,115 $15,575 ($313) Chester $7,668 $3,661 $1,825 $13,154 $6,471 Digby $6,471 $5,094 $90 $11,654 ($5,347) Erie $704 $5,749 $4,211 $10,663 2 22232448 * 1234 Plant and equipment Accumulated Depreciation Total Fixed Assets $21,900 ($7.220) $14,680 $27,200 (57,416) $19,784 $24,960 ($7,664) $17,296 $28,200 ($7,896) $20,304 $31,688 ($8,056) $23,632 $14,400 ($6,720) Total Assets $29,485 $35.359 $30,450 $31.958 $34,296 Accounts Payable Current Debt Total Current Liabilities $2,643 $867 $3,510 $3,535 $867 $4,402 $2,770 $867 $3,637 $3,024 $867 $3,891 $4,070 $3,067 $7,137 Long Term Debt Total Liabilities $5,333 $8,843 $12,349 $16.751 $4,333 $7.970 $6,833 $10,724 $5.833 $12,970 Common Stock Retained Earnings Total Equity $5,023 $15,619 $20,642 $2.323 $16,284 $18,607 $8,323 S14,156 $22.479 $2,323 $ $18,911 $21,234 $2,323 $19,002 $21,326 $2,323 $17,638 $19,961 Total Liabilities & Owners Equity $29,485 $35,359 $30,450 $31,958 $34,296 $27,815 Ferris $38,247 $28,931 Income Statement Survey Sales Variable Costs(Labor Material Carry) Contribution Margin Depreciation SGA(R&D Promo, Sales, Admin) Other(Fees, Writeoffs,TQM, Bonuses) EBIT Interest(Short term, Long term) Taxes Profit Sharing Net Profit FOUNDATION FAST TRACK Andrews $57,252 $38,912 $18,340 $1,460 $9,837 SO $7,042 $723 $2,212 $82 $4,025 Baldwin $60,173 $42,026 $18,147 $1,613 $10,291 $277 $5.965 $1,435 $1,586 $59 $2,886 Chester $44,541 $32, 100 $12,441 $1,664 $8.788 $300 $1,689 $616 $375 $14 $683 Digby $61,973 $42,571 $19,402 $1,880 $7,550 $75 $9.897 $868 $3,160 $117 $5,751 Erie $69,944 $45,813 $24,131 $2,113 $12.756 $0 $9.262 $954 $2.908 $108 $5,293 $9,316 $960 $2,599 $0 $5,758 $615 $1,800 $67 $3,276 $ Page 3 Production Analysis Fast Track Production Vs. Capacity F114672 Andrews Baldwin Chester Digby Erie Ferris 0 200 400 600 1.400 1.600 1.800 2,000 800 Capacity 1.000 1,200 O Production Primary Segment Low High Name Able Active Unit Units Inven Revision Age Pfmn Sold tory Date Dec.31 MTBF Coord 1,080 176 2/27/2020 5.1 17000 6.4 432 53 4/26/2021 0.7 17000 8.1 Size Coord Price 13.6 $35,00 11.9 $45.00 Material Labor Cost Cost $12.19 $9.41 $15.73 $13.85 2nd Shift & & Over- time 0% 60% Contr. Marg. 32% 32% Auto mation Next Round 3.0 1.0 Capacity Next Round 800 750 Plant Utiliz. 99% 108% 54% Baker Baker2 Baker3 Low High 1,223 437 0 0 11/7/2021 39 4/26/2021 0 4/4/2022 2.6 20000 0.7 17000 0.0 0 5.3 8.1 0.0 14.7 $33.50 11.9 $44.00 0.0 $0.00 $10.79 $10.69 $15.73 $12.57 $0.00 $0.00 28% 34% 0% 41% 4,0 1.8 1.0 800 500 300 153% 95% 0% 0% Low Cake C_Pie 1,311 0 75 11/20/2016 06/25/2021 5.1 21000 0.5 21000 6.4 7.6 13.6 $33.97 11.0 $39.97 $13.39 $10.33 $0.00 $0.00 28% 0% 55% 0% 3.7 0.0 1,200 0 154% 0% Daze D_Laze Low High 1,367 352 02/13/2021 3 5/25/2021 3.4 20000 0.6 18501 6.3 8.3 13.7 $33.75 11.7 $45.00 $12.88 $9.14 $16.60 $14.54 32% 30% 43% 100% 6.0 2.0 800 300 142% 118% Eat Egg Low High 1,485 399 0 10/3/2020 136 5/9/2021 3.2 18300 0.6 17500 5,5 8.2 14,5 $35.00 11.8 $45.00 $10.70 $10.89 $16.09 $14.56 37% 28% 64% 100% 4.5 1.0 1,062 620 163% 127% Fast Low 1,125 220 11/20/2016 5.1 21000 6.4 13.6 $34.00 $13.39 $11.11 24% 63% 3.0 800 161% Low Tech Segment Analysis Fast Track Accessibility F114672 Low Tech Low Tech Statistics Total Industry Unit Demand Actual Industry Unit Sales Segment % of Total Industry 6,098 16,098 166.2% Andrews Baldwin Chester Digby Erie Ferris Next Year's Segment Growth Rate 19.3% Low Tech Customer Buying Criteria Expectations Importance 1. Price $15.00 - 35.00 41% 2. Age Ideal Age = 3.0 29% 3. Reliability MTBF 14000-20000 21% 4. Ideal Position Pfmn 5.8 Size 14.2 9% Perceptual Map for Low Tech Perceptual map (at end of this year 20 40 60% 20% Actual vs Potential Market Share 2021 F114672 Low Tech 18 16 20% 14 Can 15% 12 Size 10 10% 5% 8 0% 2 0 0 2 4 Name Eat 6 8 10 12 14 16 18 20 0 Actual Potential Performance Top Products in Low Tech Segment Units Cust. Cust. Sold to Revision Stock Pfmn Size List Age Promo Aware- Sales Access- Seg Date Out Coord Coord Price MTBF Dec.31 Budget ness Budget ibility 1,285 10/3/2020 YES 5.5 14.5 $35.00 18300 3.17 $2,000 98% $3,000 65% 1,096 2/13/2021 YES 6.3 13.7 $33.75 20000 3.40 $2,000 100% $2,000 55% 1,020 11/20/2016 6.4 13.6 $33.97 21000 5.10 $1,550 86% $1,550 44% 981 11/7/2021 YES 5.3 14.7 $33.50 20000 2.62 $1,700 95% $1,700 64% 877 11/20/2016 6.4 13.6 $34.00 21000 5.10 $1,000 61% $1,000 833 2/27/2020 6.4 13.6 $35.00 17000 5.10 $1,500 91% $2,000 63% 8 4/26/2021 8.1 11.9 $44.00 17000 0.68 $1,700 65% $2,000 64% Daze Market Share 21% 18% 17% 16% 14% 14% 0% Dec. Cust Survey 28 31 14 32 11 10 0 Cake Baker Fast Able Baker2 31% 133.8% Foundation High Tech Segment Analysis Fast Track High Tech Statistics Accessibility F114672 High Tech Total Industry Unit Demand 3,113 Actual Industry Unit Sales Andrews 13.113 Segment % of Total Industry Baldwin Next Year's Segment Growth Rate 121.3% Chester High Tech Customer Buying Criteria Digby Expectations Importance Erie 1. Ideal Position Pfmn 8.8 Size 11.2 33% 2. Age Ideal Age = 0.0 29% Ferris 3. Price $25.00 - 45.00 25% 4. Reliability MTBF 17000-23000 13% 20% 40% Perceptual Map for High Tech Actual vs Potential Market Share Perceptual map (at end of this year) 2021 F114672 High Tech 20 60% 18 20% 16 14 15% 12 Size 10% 10 8 5% 6 0% 4 2. 0 0 LIL TOTAL 2 4 Name Active Baker2 Egg D_Laze Cake Market Share 14% 14% 13% 11% 9% 9% 8% 8% 8% 6% 6 8 10 12 14 16 18 20 0 Actual Potential Performance Top Products in High Tech Segment Units Cust. Cust. Sold to Revision Stock Pfmn Size List Age Promo Aware- Sales Access- Seg Date Out Coord Coord Price MTBF Dec.31 Budget ness Budget ibility 432 4/26/2021 8.1 11.9 $45.00 17000 0.68 $2,000 70% $3,000 68% 429 4/26/2021 8.1 11.9 $44.00 17000 0.68 $1,700 65% $2,000 74% 399 5/9/2021 8.2 11.8 $45.00 17500 0.64 $2,000 70% $3,000 67% 352 5/25/2021 8.3 11.7 $45.00 18501 0.60 $2,000 70% $0 55% 292 11/20/2016 6.4 13.6 $33.97 21000 5.10 $1,550 86% $1,550 62% 271 2/13/2021 YES 6.3 13.7 $33.75 20000 3.40 $2,000 $2,000 55% 248 11/20/2016 6.4 13.6 $34.00 21000 5.10 $1,000 61% $1,000 31% 248 2/27/2020 6.4 13.6 $35.00 17000 5.10 $1,500 91% $2,000 68% 242 11/7/2021 YES 5.3 14.7 $33.50 20000 2.62 $1,700 95% $1,700 74% 200 10/3/2020 YES 5.5 14.5 $35.00 18300 3.17 $2,000 98% $3,000 67% Dec. Cust Survey 26 26 28 25 9 9 6 5 7 6 Daze 100% Fast Able Baker Eat Foundation Market Share Fast Track Market Share F114672 20%. 10%. Units Sold vs Demand Chart F114672 6,000 5,000 4.000 3.000 2.000 1.000 0 Low 0% Andrews Digby Chester High Baldwin Industry Unit Sales Total Unit Demand Low High Actual Market Share in Units Low 6,098 66.2% Industry Unit Sales % of Market High 3,113 33.8% Potential Market Share in Units Totall Low High 9,211 Units Demanded 6,098 3,113 100.0% % of Market 66.2% Total 9,211 100.0% 33.8% 13.7% 9.5% Able Active Total 8.0% 13.9% 21.8% 11.7% Able 4.7% Active 16.4% Total 6.0% 13.9% 19.9% 8.3% 4.7% 13,0% 13.7% 9.6% 18.8% Baker Baker2 Total 16.1% 0.1% 16.2% 7.8% 13.8% 21.5% 13.3% Baker 4.7% Baker2 18.0% Total 9.6% 13.8% 23.4% 15.7% 4.7% 20.4% 18.9% Cake Total 16.7% 16.7% 9.4% 14.2% Cake 14.2% Total 13.6% 13.6% 9.4% 9.3% 12.1% 12.1% 9.4% 18.0% 24.4% Daze D Laze Total 8.7% 11.3% 20.0% 14.8%l Daze 3.8% D_Laze 18.7% Total 10.2% 10.9% 21.1% 19.6% 3.7% 23.3% 18.0% 24.4% 21.1% 23.3% Eat Egg Total 6.4% 12.8% 19.3% 16.1% Eat 4.3% Egg 20.5% Total 7.4% 12.4% 19.8% 18.0% 4.2% 22.1% 21.1% 23.3% Fast Total 14.4% 14.4% 8.0% 8.0% 12.2% Fast 12.2% Total 10.4% 10.4% 6.4% 6.4% 9.0% 9.0% Foundation Perceptual Map Fast Track Perceptual Map for All Segments Perceptual map (at end of this year) 20 18 16 14 12 DEDaze C_Pie Size 10 8 6 2 0 0 2 4 6 8 10 12 14 16 18 20 Performance Andrews Baldwin Name Able Active Pfmn 6.4 8.1 Size 13.6 11.9 Revised Name 2/27/2020 Baker 4/26/2021 Baker2 Pfmn 5.3 8.1 Size 14.7 11.9 Revised 11/7/2021 4/26/2021 Name Cake C_Pie Chester Pfmn Size 6.4 13.6 7.6 11.0 Revised 11/20/2016 6/25/2021 Digby Erie Ferris Name Daze D_Laze Pfmn 6.3 8.3 Size 13.7 11.7 Revised Name 2/13/2021 Eat 5/25/2021 Egg Pfmn 5.5 8.2 Size 14.5 11.8 Revised 10/3/2020 5/9/2021 Name Fast Pfmn 6.4 Size 13.6 Revised 11/20/2016 HR/TQM Report Fast Track HUMAN RESOURCES SUMMARY Digby 274 Baldwin 340 340 227 113 Chester 262 263 169 94 274 Erie 427 428 246 182 174 100 Needed Complement Complement 1st Shift Complement 2nd Shift Complement Overtime Percent Turnover Rate New Employees Separated Employees Recruiting Spend Training Hours Productivity Index Recruiting Cost Separation Cost Training Cost Total HR Admin Cost Andrews 272 272 228 44 0.0% 10.0% 27 26 $0 0 100.0% $27 $130 $0 $157 0.0% 10.0% 105 0 $0 0 100.0% $105 $0 $0 $105 0.0% 7.0% 18 6 $3,500 80 101.7% 0.0% 10.0% 27 14 $0 0 100.0% $27 $70 $0 $97 0.0% 7.0% 208 0 $2,200 80 102.2% 100.0% $665 $83 $30 $421 $534 $0 $685 $1,350 Strike Days TQM SUMMARY Andrews Baldwin Chester Digby Erie Ferris Process Mgt Budgets Last Year CPI Systems VendorJIT Quality Initiative Training Channel Support Systems Concurrent Engineering UNEP Green Programs $0 $0 $0 $0 $0 $0 $0 $0 $0 $0 $0 $0 $0 $0 $0 $0 $0 $0 $0 $0 $0 $0 $0 $0 $0 $0 $0 $0 $0 $0 $0 $0 $0 TQM Budgets Last Year Benchmarking Quality Function Deployment Effort CCE/6 Sigma Training GEMI TQEM Sustainability Initiatives Total Expenditures $0 $0 $0 $0 $0 $0 $0 $0 $0 $0 $0 $0 $0 $0 $0 $0 $0 $0 $0 $0 $0 $0 $0 $0 $0 $0 Cumulative Impacts Material Cost Reduction Labor Cost Reduction Reduction R&D Cycle Time Reduction Admin Costs Demand Increase 0.00% 0.00% 0.00% 0.00% 0.00% 0.00% 0.00% 0.00% 0.00% 0.00% 0.00% 0.00% 0.00% 0.00% 0.00% 0.00% 0.00% 0.00% 0.00% 0.00% 0.00% 0.00% 0.00% 0.00% 0.00% 0.00% 0.00% 0.00% 0.00% 0.00% Foundation Ethics Report Fast Track ETHICS SUMMARY Other (Fees, Writeoffs, etc.) Demand Factor Material Cost Impact Admin Cost Impact Productivity Impact Awareness Impact Accessibility Impact The actual dollar impact. Example, $120 means Other increased by $120. The % of normal. 98% means demand fell 2%. The % of normal. 104% means matieral costs rose 4%. The % of normal. 103% means admin costs rose 3%. The % of normal. 104% means productivity increased by 4%. The % of normal. 105% means normal awareness was multiplied by 1.05. The % of normal. 98% means normal accessiblity was multiplied by 0.98. Normal means the value that would have been produced if the problem had not been presented. No Impact Andrews Baldwin Chester Digby Erie Ferris Total Other (Fees, Writeoffs, etc.) Demand Factor Material Cost Impact Admin Cost Impact Productivity Impact Awareness Impact Accessibility Impact $0 100% 100% 100% 100% 100% 100% $0 100% 100% 100% 100% 100% 100% $0 100% 100% 100% 100% 100% 100% $0 100% 100% 100% 100% 100% 100% $0 100% 100% 100% 100% 100% 100% $0 100% 100% 100% 100% 100% 100% $0 100% 100% 100% 100% 100% 100% Section C: Capsim Advanced Forecasting (10 marks) Refer to the FastTrack posted in the Finance & Forecasting Assignment tab on the course website. Assume you are part of Team Digby and are responsible for making forecasting decisions for its product, D_Laze. You are forecasting for Round 3. Please answer the following questions. a) Identify the primary segment of the product at the end of Round 2. What was the total industry unit demand for this segment in Round 2? What will be the total demand for the segment in Round 3? (2 marks) b) Using the advanced forecasting method only, what is the worst-case market share that the product should achieve in Round 3? Calculate the worst-case demand in units for Round 3 using this market share. (4 marks) c) Are there any factors that make you believe that the worst-case market share calculated in step 2 is too low, or too high? Identify at least two factors which may have an impact and explain if each factor should increase or decrease the worst-case market share (you do not need to specify by how much). (4 marks) Round: 2 Foundation FastTrack Selected Financial Statistics Chester 1.5% 1.46 2.2% 1.4 3.0% Andrews 7.0% 1.94 13.7% 1.4 19.5% $0 $57,251,651 $7,042,449 $4,025,404 $7,582,120 17.2% 32.0% ROS Asset Turnover ROA Leverage ROE Emergency Loan Sales EBIT Profits Cumulative Profit SG&A / Sales Contrib. Margin % Baldwin 4.8% 1.70 8.2% 1.9 15.5% $O $60,172,811 $5,965,031 $2,885,669 $8,247,471 17.1% 30.2% % SO Digby 9.3% 1.94 18.0% 1.5 27.1% $0 $61,973,247 $9,897,066 $5,751,409 $10,874,381 12.2% 31.3% Erie 7.6% 2.04 15.4% 1.6 24.8% $0 $69,943,986 $9,262,328 $5,292,660 $10,965,654 18.2% 34.5% Ferris 8.6% 1.38 11.8% 1.4 16.4% $0 $38,247,115 $5,757,749 $3,275,719 $9,600,815 6.8% 24.4% $44,540,719 600 $1,688,630 $683,138 $6,238,541 19.7% 27.9% Percent of Sales F114672 S Market Share F114672 100% 90% 80% 70% 60% 50% 40% 30% 20% 10% Var Cost Depr O SGA Other Profit O Andrews 17.24% Baldwin 18.12% Chester 13.41 % Digby 18.66 % Erie 21.06% Ferris 11.52 % Andrews Chester Digby Erie Ferris FOUNDATION FAST TRACK Page 1 Stock & Bonds Fast Track Change PIE Company Andrews Baldwin Chester Digby Erie Ferris $9.30 Close $15.54 $16.50 $13.39 $21.87 $21.78 $18.73 Stock Market Summary MarketCap Book Value Shares (SM) Per Share 2,241,775 $35 $9,21 2,000,000 $33 2,386,002 $32 $9.42 2,000,000 $44 $10.62 2,000,000 $44 $10.66 2,000,000 $37 $9.98 $4.90 $1.34 ($2.15) $8.66 $6.00 $1.64 EPS $1,80 $1.44 $0.29 $2.88 $2.65 $1.64 Dividend $0.00 $0.00 $0.05 $0.00 $0.00 $0.00 Yield 0.0% 0.0% 0.4% 0.0% 0.0% 0.0% 8.7 11.4 46.6 7.6 8.2 11.4 Closing Stock Price F114672 $40 S35 S30 $25 $20 S15 $10 S5 SO Andrews Baldwin Chester Digby Erie Ferris 2019 2020 2021 2022 2023 2024 2025 2026 2027 Series# Company Andrews Face Yield Yield Close$ S&P P 12.0S2023 $1,733,333 13.0S2025 $2,600,000 10.082030 $1,000,000 11.4% 11.6% 9.5% Bond Market Summary Closes S&P Company Series# Face Digby 104.91 AA 12.0S2023 $1,733,333 112.26 AA 13.0S2025 $2,600,000 104.76 AA 10.052030 $1,000,000 9.9S2031 $1,500,000 101.71 B Erie 106.20 B 12.052023 $1,733,333 94.46 B 13.0S2025 $2,600,000 95.29 B 10.052030 $1,500,000 Ferris 105.46 AAA 12.0S2023 $1,733,333 113.31 AAA 13.0S2025 $2,600,000 11.5% 11.7% 9.7% 9.7% 104.37 111.22 102.94 102.51 A A A A Baldwin 12.0S2023 $1,733,333 13.0S2025 $2,600,000 10.082030 $2,480,000 10.252031 $5,536,000 11.8% 12.2% 10.6% 10.7% 11.6% 11.8% 9.9% 103.65 109.85 100.58 A Chester 12.0S2023 $1,733,333 13.0S2025 $2,600,000 11,4% 11.5% 11.4% 11.5% 105.09 112.61 AA AA Next Year's Prime Rate 7.00% FOUNDATION FAST TRACK Page 2 Foundation Financial Summary Andrews Baldwin Chester Digby Erie Ferris $4,025 $2,886 $683 $5,751 $5,293 $3,276 Cash Flow Statement Survey CashFlows from operating activities Net Income (Loss) Adjustment for non-cash items: Depreciation Extraordinary gains/losses/writeoffs Changes in current assets and liablilities Accounts payable Inventory Accounts Receivable Net cash from operations $1,460 SO $1,613 $0 $1,664 $0 $1,880 $0 $2,113 $0 $960 $0 ($547) $6,069 ($1,374) $9,634 $589 ($1,115) ($707) $3,266 ( ($209) ($1,825) $453 $766 ($59 $5,770 ($1,236 $12,107 $1,396 ($4,211) ($1,795) $2,795 ($93) ($4,026) $536 $653 ($3,000) ($5,960) ($6,960) ($6,960) ($10,342) Cash flows from investing activities Plant improvements(net) Cash flows from financing activities Dividends paid Sales of common stock Purchase of common stock Cash from long term debt issued Early retirement of long term debt Retirement of current debt Cash from current debt borrowing Cash from emergency loan SO SO SO SO SO ($2,238) SO SO SO $0 $0 $5,536 $o $0 $0 $0 ($119) $6,000 SO SO $o $0 $0 $0 $0 $0 $0 $1,500 $0 $ ($176) $0 $0 $0 $0 $0 $0 $0 $0 $2,200 $0 Net cash from financing activities ($2,238) $5,536 $5,881 $1,324 $2,200 $11,467 Net change in cash position Balance Sheet Survey Cash Accounts Receivable Inventory Total Current Assets $4,396 Andrews $4,396 $4,706 $5,704 $14,805 $2,843 Baldwin $9,515 $4,946 $1,115 $15,575 ($313) Chester $7,668 $3,661 $1,825 $13,154 $6,471 Digby $6,471 $5,094 $90 $11,654 ($5,347) Erie $704 $5,749 $4,211 $10,663 2 22232448 * 1234 Plant and equipment Accumulated Depreciation Total Fixed Assets $21,900 ($7.220) $14,680 $27,200 (57,416) $19,784 $24,960 ($7,664) $17,296 $28,200 ($7,896) $20,304 $31,688 ($8,056) $23,632 $14,400 ($6,720) Total Assets $29,485 $35.359 $30,450 $31.958 $34,296 Accounts Payable Current Debt Total Current Liabilities $2,643 $867 $3,510 $3,535 $867 $4,402 $2,770 $867 $3,637 $3,024 $867 $3,891 $4,070 $3,067 $7,137 Long Term Debt Total Liabilities $5,333 $8,843 $12,349 $16.751 $4,333 $7.970 $6,833 $10,724 $5.833 $12,970 Common Stock Retained Earnings Total Equity $5,023 $15,619 $20,642 $2.323 $16,284 $18,607 $8,323 S14,156 $22.479 $2,323 $ $18,911 $21,234 $2,323 $19,002 $21,326 $2,323 $17,638 $19,961 Total Liabilities & Owners Equity $29,485 $35,359 $30,450 $31,958 $34,296 $27,815 Ferris $38,247 $28,931 Income Statement Survey Sales Variable Costs(Labor Material Carry) Contribution Margin Depreciation SGA(R&D Promo, Sales, Admin) Other(Fees, Writeoffs,TQM, Bonuses) EBIT Interest(Short term, Long term) Taxes Profit Sharing Net Profit FOUNDATION FAST TRACK Andrews $57,252 $38,912 $18,340 $1,460 $9,837 SO $7,042 $723 $2,212 $82 $4,025 Baldwin $60,173 $42,026 $18,147 $1,613 $10,291 $277 $5.965 $1,435 $1,586 $59 $2,886 Chester $44,541 $32, 100 $12,441 $1,664 $8.788 $300 $1,689 $616 $375 $14 $683 Digby $61,973 $42,571 $19,402 $1,880 $7,550 $75 $9.897 $868 $3,160 $117 $5,751 Erie $69,944 $45,813 $24,131 $2,113 $12.756 $0 $9.262 $954 $2.908 $108 $5,293 $9,316 $960 $2,599 $0 $5,758 $615 $1,800 $67 $3,276 $ Page 3 Production Analysis Fast Track Production Vs. Capacity F114672 Andrews Baldwin Chester Digby Erie Ferris 0 200 400 600 1.400 1.600 1.800 2,000 800 Capacity 1.000 1,200 O Production Primary Segment Low High Name Able Active Unit Units Inven Revision Age Pfmn Sold tory Date Dec.31 MTBF Coord 1,080 176 2/27/2020 5.1 17000 6.4 432 53 4/26/2021 0.7 17000 8.1 Size Coord Price 13.6 $35,00 11.9 $45.00 Material Labor Cost Cost $12.19 $9.41 $15.73 $13.85 2nd Shift & & Over- time 0% 60% Contr. Marg. 32% 32% Auto mation Next Round 3.0 1.0 Capacity Next Round 800 750 Plant Utiliz. 99% 108% 54% Baker Baker2 Baker3 Low High 1,223 437 0 0 11/7/2021 39 4/26/2021 0 4/4/2022 2.6 20000 0.7 17000 0.0 0 5.3 8.1 0.0 14.7 $33.50 11.9 $44.00 0.0 $0.00 $10.79 $10.69 $15.73 $12.57 $0.00 $0.00 28% 34% 0% 41% 4,0 1.8 1.0 800 500 300 153% 95% 0% 0% Low Cake C_Pie 1,311 0 75 11/20/2016 06/25/2021 5.1 21000 0.5 21000 6.4 7.6 13.6 $33.97 11.0 $39.97 $13.39 $10.33 $0.00 $0.00 28% 0% 55% 0% 3.7 0.0 1,200 0 154% 0% Daze D_Laze Low High 1,367 352 02/13/2021 3 5/25/2021 3.4 20000 0.6 18501 6.3 8.3 13.7 $33.75 11.7 $45.00 $12.88 $9.14 $16.60 $14.54 32% 30% 43% 100% 6.0 2.0 800 300 142% 118% Eat Egg Low High 1,485 399 0 10/3/2020 136 5/9/2021 3.2 18300 0.6 17500 5,5 8.2 14,5 $35.00 11.8 $45.00 $10.70 $10.89 $16.09 $14.56 37% 28% 64% 100% 4.5 1.0 1,062 620 163% 127% Fast Low 1,125 220 11/20/2016 5.1 21000 6.4 13.6 $34.00 $13.39 $11.11 24% 63% 3.0 800 161% Low Tech Segment Analysis Fast Track Accessibility F114672 Low Tech Low Tech Statistics Total Industry Unit Demand Actual Industry Unit Sales Segment % of Total Industry 6,098 16,098 166.2% Andrews Baldwin Chester Digby Erie Ferris Next Year's Segment Growth Rate 19.3% Low Tech Customer Buying Criteria Expectations Importance 1. Price $15.00 - 35.00 41% 2. Age Ideal Age = 3.0 29% 3. Reliability MTBF 14000-20000 21% 4. Ideal Position Pfmn 5.8 Size 14.2 9% Perceptual Map for Low Tech Perceptual map (at end of this year 20 40 60% 20% Actual vs Potential Market Share 2021 F114672 Low Tech 18 16 20% 14 Can 15% 12 Size 10 10% 5% 8 0% 2 0 0 2 4 Name Eat 6 8 10 12 14 16 18 20 0 Actual Potential Performance Top Products in Low Tech Segment Units Cust. Cust. Sold to Revision Stock Pfmn Size List Age Promo Aware- Sales Access- Seg Date Out Coord Coord Price MTBF Dec.31 Budget ness Budget ibility 1,285 10/3/2020 YES 5.5 14.5 $35.00 18300 3.17 $2,000 98% $3,000 65% 1,096 2/13/2021 YES 6.3 13.7 $33.75 20000 3.40 $2,000 100% $2,000 55% 1,020 11/20/2016 6.4 13.6 $33.97 21000 5.10 $1,550 86% $1,550 44% 981 11/7/2021 YES 5.3 14.7 $33.50 20000 2.62 $1,700 95% $1,700 64% 877 11/20/2016 6.4 13.6 $34.00 21000 5.10 $1,000 61% $1,000 833 2/27/2020 6.4 13.6 $35.00 17000 5.10 $1,500 91% $2,000 63% 8 4/26/2021 8.1 11.9 $44.00 17000 0.68 $1,700 65% $2,000 64% Daze Market Share 21% 18% 17% 16% 14% 14% 0% Dec. Cust Survey 28 31 14 32 11 10 0 Cake Baker Fast Able Baker2 31% 133.8% Foundation High Tech Segment Analysis Fast Track High Tech Statistics Accessibility F114672 High Tech Total Industry Unit Demand 3,113 Actual Industry Unit Sales Andrews 13.113 Segment % of Total Industry Baldwin Next Year's Segment Growth Rate 121.3% Chester High Tech Customer Buying Criteria Digby Expectations Importance Erie 1. Ideal Position Pfmn 8.8 Size 11.2 33% 2. Age Ideal Age = 0.0 29% Ferris 3. Price $25.00 - 45.00 25% 4. Reliability MTBF 17000-23000 13% 20% 40% Perceptual Map for High Tech Actual vs Potential Market Share Perceptual map (at end of this year) 2021 F114672 High Tech 20 60% 18 20% 16 14 15% 12 Size 10% 10 8 5% 6 0% 4 2. 0 0 LIL TOTAL 2 4 Name Active Baker2 Egg D_Laze Cake Market Share 14% 14% 13% 11% 9% 9% 8% 8% 8% 6% 6 8 10 12 14 16 18 20 0 Actual Potential Performance Top Products in High Tech Segment Units Cust. Cust. Sold to Revision Stock Pfmn Size List Age Promo Aware- Sales Access- Seg Date Out Coord Coord Price MTBF Dec.31 Budget ness Budget ibility 432 4/26/2021 8.1 11.9 $45.00 17000 0.68 $2,000 70% $3,000 68% 429 4/26/2021 8.1 11.9 $44.00 17000 0.68 $1,700 65% $2,000 74% 399 5/9/2021 8.2 11.8 $45.00 17500 0.64 $2,000 70% $3,000 67% 352 5/25/2021 8.3 11.7 $45.00 18501 0.60 $2,000 70% $0 55% 292 11/20/2016 6.4 13.6 $33.97 21000 5.10 $1,550 86% $1,550 62% 271 2/13/2021 YES 6.3 13.7 $33.75 20000 3.40 $2,000 $2,000 55% 248 11/20/2016 6.4 13.6 $34.00 21000 5.10 $1,000 61% $1,000 31% 248 2/27/2020 6.4 13.6 $35.00 17000 5.10 $1,500 91% $2,000 68% 242 11/7/2021 YES 5.3 14.7 $33.50 20000 2.62 $1,700 95% $1,700 74% 200 10/3/2020 YES 5.5 14.5 $35.00 18300 3.17 $2,000 98% $3,000 67% Dec. Cust Survey 26 26 28 25 9 9 6 5 7 6 Daze 100% Fast Able Baker Eat Foundation Market Share Fast Track Market Share F114672 20%. 10%. Units Sold vs Demand Chart F114672 6,000 5,000 4.000 3.000 2.000 1.000 0 Low 0% Andrews Digby Chester High Baldwin Industry Unit Sales Total Unit Demand Low High Actual Market Share in Units Low 6,098 66.2% Industry Unit Sales % of Market High 3,113 33.8% Potential Market Share in Units Totall Low High 9,211 Units Demanded 6,098 3,113 100.0% % of Market 66.2% Total 9,211 100.0% 33.8% 13.7% 9.5% Able Active Total 8.0% 13.9% 21.8% 11.7% Able 4.7% Active 16.4% Total 6.0% 13.9% 19.9% 8.3% 4.7% 13,0% 13.7% 9.6% 18.8% Baker Baker2 Total 16.1% 0.1% 16.2% 7.8% 13.8% 21.5% 13.3% Baker 4.7% Baker2 18.0% Total 9.6% 13.8% 23.4% 15.7% 4.7% 20.4% 18.9% Cake Total 16.7% 16.7% 9.4% 14.2% Cake 14.2% Total 13.6% 13.6% 9.4% 9.3% 12.1% 12.1% 9.4% 18.0% 24.4% Daze D Laze Total 8.7% 11.3% 20.0% 14.8%l Daze 3.8% D_Laze 18.7% Total 10.2% 10.9% 21.1% 19.6% 3.7% 23.3% 18.0% 24.4% 21.1% 23.3% Eat Egg Total 6.4% 12.8% 19.3% 16.1% Eat 4.3% Egg 20.5% Total 7.4% 12.4% 19.8% 18.0% 4.2% 22.1% 21.1% 23.3% Fast Total 14.4% 14.4% 8.0% 8.0% 12.2% Fast 12.2% Total 10.4% 10.4% 6.4% 6.4% 9.0% 9.0% Foundation Perceptual Map Fast Track Perceptual Map for All Segments Perceptual map (at end of this year) 20 18 16 14 12 DEDaze C_Pie Size 10 8 6 2 0 0 2 4 6 8 10 12 14 16 18 20 Performance Andrews Baldwin Name Able Active Pfmn 6.4 8.1 Size 13.6 11.9 Revised Name 2/27/2020 Baker 4/26/2021 Baker2 Pfmn 5.3 8.1 Size 14.7 11.9 Revised 11/7/2021 4/26/2021 Name Cake C_Pie Chester Pfmn Size 6.4 13.6 7.6 11.0 Revised 11/20/2016 6/25/2021 Digby Erie Ferris Name Daze D_Laze Pfmn 6.3 8.3 Size 13.7 11.7 Revised Name 2/13/2021 Eat 5/25/2021 Egg Pfmn 5.5 8.2 Size 14.5 11.8 Revised 10/3/2020 5/9/2021 Name Fast Pfmn 6.4 Size 13.6 Revised 11/20/2016 HR/TQM Report Fast Track HUMAN RESOURCES SUMMARY Digby 274 Baldwin 340 340 227 113 Chester 262 263 169 94 274 Erie 427 428 246 182 174 100 Needed Complement Complement 1st Shift Complement 2nd Shift Complement Overtime Percent Turnover Rate New Employees Separated Employees Recruiting Spend Training Hours Productivity Index Recruiting Cost Separation Cost Training Cost Total HR Admin Cost Andrews 272 272 228 44 0.0% 10.0% 27 26 $0 0 100.0% $27 $130 $0 $157 0.0% 10.0% 105 0 $0 0 100.0% $105 $0 $0 $105 0.0% 7.0% 18 6 $3,500 80 101.7% 0.0% 10.0% 27 14 $0 0 100.0% $27 $70 $0 $97 0.0% 7.0% 208 0 $2,200 80 102.2% 100.0% $665 $83 $30 $421 $534 $0 $685 $1,350 Strike Days TQM SUMMARY Andrews Baldwin Chester Digby Erie Ferris Process Mgt Budgets Last Year CPI Systems VendorJIT Quality Initiative Training Channel Support Systems Concurrent Engineering UNEP Green Programs $0 $0 $0 $0 $0 $0 $0 $0 $0 $0 $0 $0 $0 $0 $0 $0 $0 $0 $0 $0 $0 $0 $0 $0 $0 $0 $0 $0 $0 $0 $0 $0 $0 TQM Budgets Last Year Benchmarking Quality Function Deployment Effort CCE/6 Sigma Training GEMI TQEM Sustainability Initiatives Total Expenditures $0 $0 $0 $0 $0 $0 $0 $0 $0 $0 $0 $0 $0 $0 $0 $0 $0 $0 $0 $0 $0 $0 $0 $0 $0 $0 Cumulative Impacts Material Cost Reduction Labor Cost Reduction Reduction R&D Cycle Time Reduction Admin Costs Demand Increase 0.00% 0.00% 0.00% 0.00% 0.00% 0.00% 0.00% 0.00% 0.00% 0.00% 0.00% 0.00% 0.00% 0.00% 0.00% 0.00% 0.00% 0.00% 0.00% 0.00% 0.00% 0.00% 0.00% 0.00% 0.00% 0.00% 0.00% 0.00% 0.00% 0.00% Foundation Ethics Report Fast Track ETHICS SUMMARY Other (Fees, Writeoffs, etc.) Demand Factor Material Cost Impact Admin Cost Impact Productivity Impact Awareness Impact Accessibility Impact The actual dollar impact. Example, $120 means Other increased by $120. The % of normal. 98% means demand fell 2%. The % of normal. 104% means matieral costs rose 4%. The % of normal. 103% means admin costs rose 3%. The % of normal. 104% means productivity increased by 4%. The % of normal. 105% means normal awareness was multiplied by 1.05. The % of normal. 98% means normal accessiblity was multiplied by 0.98. Normal means the value that would have been produced if the problem had not been presented. No Impact Andrews Baldwin Chester Digby Erie Ferris Total Other (Fees, Writeoffs, etc.) Demand Factor Material Cost Impact Admin Cost Impact Productivity Impact Awareness Impact Accessibility Impact $0 100% 100% 100% 100% 100% 100% $0 100% 100% 100% 100% 100% 100% $0 100% 100% 100% 100% 100% 100% $0 100% 100% 100% 100% 100% 100% $0 100% 100% 100% 100% 100% 100% $0 100% 100% 100% 100% 100% 100% $0 100% 100% 100% 100% 100% 100%
Step by Step Solution
There are 3 Steps involved in it

Get step-by-step solutions from verified subject matter experts