

Question: SECTION D Based on the information provided below, answer questions 17 to 21. A business researcher with a keen interest in micro, small and medium
SECTION D Based on the information provided below, answer questions 17 to 21. A business researcher with a keen interest in micro, small and medium enterprises (MSMEs) is investigating the relationship between the average annual sales and average annual earnings of 20 MSMEs in the Western Cape province described as the most resilient during the Covid-19 pandemic' in a recent article. Table D, below, shows the data collected from the 20 MSMEs for the 2020-2022 period. Table D: Average annual sales and average annual earnings of 20 MDMEs in the Western Cape Province for the 2020-2022 period. #MSME 1 2 3 4 5 6 7 8 9 Average annual sales, R millions Average annual earnings, 11,4 4,5 1,3 8 6,6 5,1 2,6 1,7 3,5 8,2 4,4 12,8 3,4 7,3 4,6 5,5 10,3 10,5 7,6 5,2 R millions QUESTION 17 As part of the preliminary analysis of the data provided in Table D, the researcher produced the scatter plot below. (1) (11) (IV) (V) (VI) A. (I), (II), and (VI) B. (II), (III), and (V) C. (III), (IV), and (V) D. (II), (IV) and (V) 89,2 19,3 18,2 71,7 58,7 46,8 17,5 11,9 20 51,2 28,9 69,2 32,4 62,3 25,4 39,6 78,3 81,2 55,9 41,1 Which THREE of the following assumptions are inferable or discernible from the scatter plot? Whether the sample of 20 MSMEs is representative of the population of MSMEs in the Western Cape province. Whether the assumption of a linear relationship between the independent variable and the dependent variable has been met or violated. Whether the assumption of normality of the independent variable and the dependent variable has been met or violated. The absence or presence of outliers in the data set. The direction of the relationship between the independent variable and the dependent variable. The significance of the relationship between the independent variable and the dependent variable. B. 0.4914 14 QUESTION 18 Compute the correlation coefficient for the data in Table D.. A. 0.8561 C. 0.9253 Scatter plot of Sales vs Earnings D. 0.9836 19 20 QUESTION 19 Determine the linear regression equation of the relationship between the independent variable (x) and the dependent variable (y). A. y = 0.4914x +0.1248 B. y = 0.4914+0.1248x C. y = 0.4914x -0.1248 D. y=-0.4914 +0.1248x QUESTION 20 For a small enterprise with an average annual sales amounting to R50 million during the 2020-2022 period, estimate the average annual earnings for the period. A. Approximately R6.2 million B. Approximately R6.9 million C. Approximately R6.7 million. D. Approximately R6.5 million (20MARKS) (4 marks) 6/9 (4 marks) (4 marks) (4 marks)
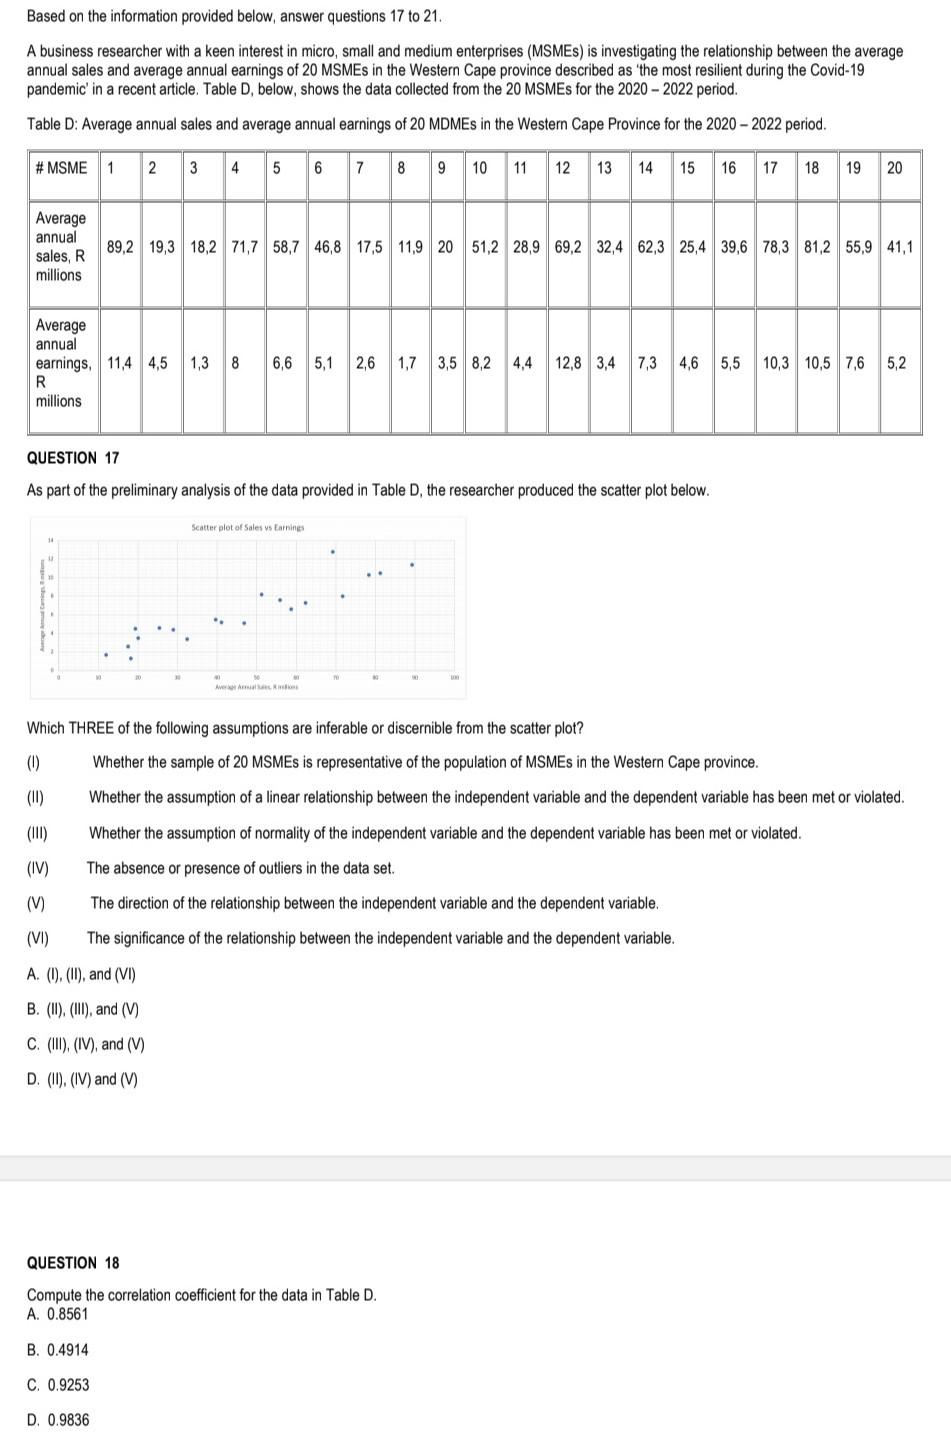
Based on the information provided below, answer questions 17 to 21 . A business researcher with a keen interest in micro, small and medium enterprises (MSMEs) is investigating the relationship between the average annual sales and average annual earnings of 20 MSMEs in the Western Cape province described as 'the most resilient during the Covid- 19 pandemic' in a recent article. Table D, below, shows the data collected from the 20 MSMEs for the 20202022 period. Table D: Average annual sales and average annual earnings of 20 MDMEs in the Western Cape Province for the 2020 - 2022 period. QUESTION 17 As part of the preliminary analysis of the data provided in Table D, the researcher produced the scatter plot below. Which THREE of the following assumptions are inferable or discernible from the scatter plot? (I) Whether the sample of 20 MSMEs is representative of the population of MSMEs in the Western Cape province. (II) Whether the assumption of a linear relationship between the independent variable and the dependent variable has been met or violated. (III) Whether the assumption of normality of the independent variable and the dependent variable has been met or violated. (IV) The absence or presence of outliers in the data set. (V) The direction of the relationship between the independent variable and the dependent variable. (VI) The significance of the relationship between the independent variable and the dependent variable. A. (I), (II), and (VI) B. (III), (III), and (V) C. (III), (IV), and (V) D. (II), (IV) and (V) QUESTION 18 Compute the correlation coefficient for the data in Table D. A. 0.8561 B. 0.4914 C. 0.9253 D. 0.9836
Step by Step Solution
There are 3 Steps involved in it

Get step-by-step solutions from verified subject matter experts