

Question: Section D: Data Visualization (10 marks) NSW Health Department launched a webpage for visualising COVID-19 cases and vaccination status. Please see screenshot of the webpage
Section D: Data Visualization (10 marks)
NSW Health Department launched a webpage for visualising COVID-19 cases and vaccination status.
Please see screenshot of the webpage below and
1) provide your critiques of the data visualization of the webpage (4 marks)
2) outline how you would proceed, considering both the design issues as well as the technical issues of using ggplot2 or Tableau to produce your desired graphic. You are only required to use either ggplot2 or Tableau to outline your design plan. If you choose to use ggplot2, please outline and explain your code structure. If you choose to use Tableau, please outline and explain your development plan by discussing the visualization tools and techniques. (6 marks)
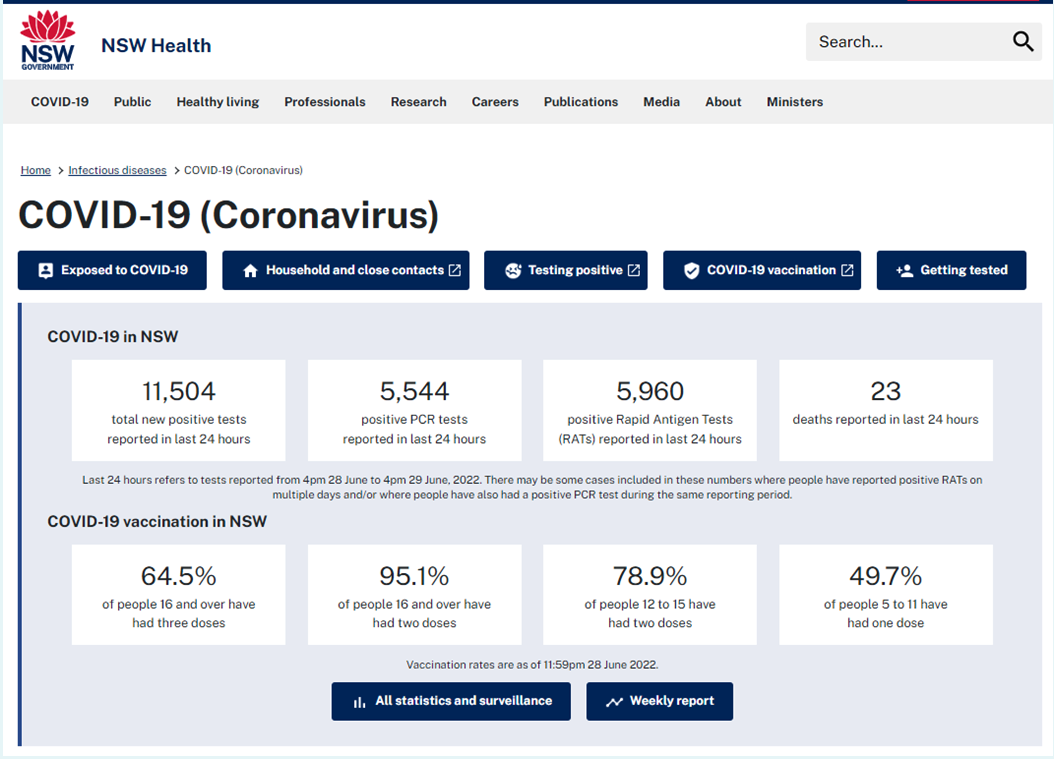
COVID-19 (Coronavirus) COVID-19 in NSW 11,504 total new positive tests reported in last 24 hours Last 24 hours refers to tests reported from 4pm28 June to 4pm29 June, 2022 . There may be some cases includod in these numbers where people have reported positive RATs on multiple days and/or where people have also had a positive PCR test during the same reporting period. Vaccination rates are as of 11:59pm 28 June 2022. COVID-19 (Coronavirus) COVID-19 in NSW 11,504 total new positive tests reported in last 24 hours Last 24 hours refers to tests reported from 4pm28 June to 4pm29 June, 2022 . There may be some cases includod in these numbers where people have reported positive RATs on multiple days and/or where people have also had a positive PCR test during the same reporting period. Vaccination rates are as of 11:59pm 28 June 2022
Step by Step Solution
There are 3 Steps involved in it

Get step-by-step solutions from verified subject matter experts