

Question: Section E The bar chart below shows the number of students that passed STATlS in 2013, 2014 and 2015. I BSc g Other I Commerce
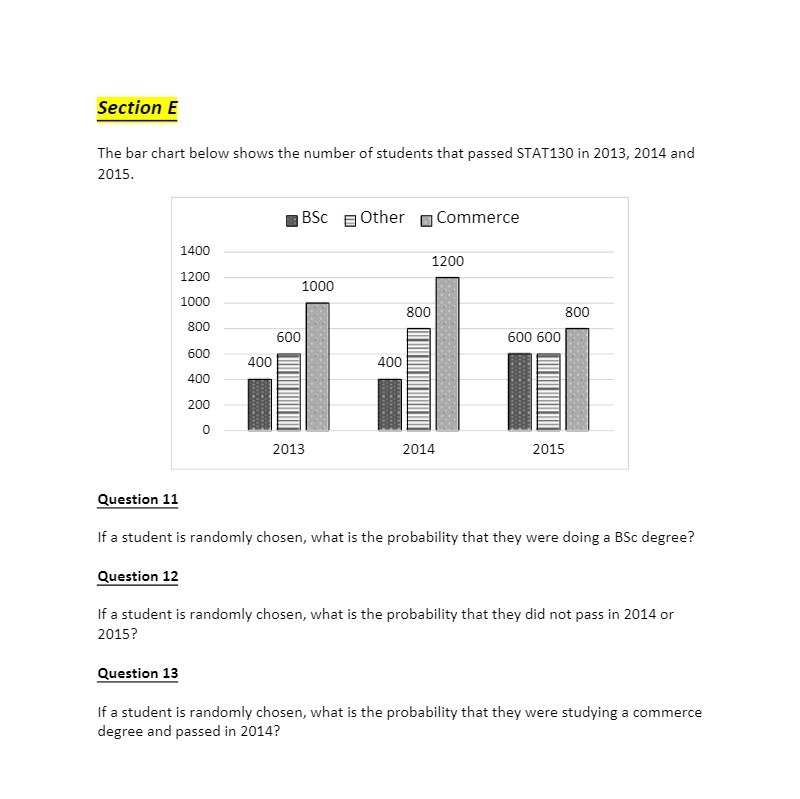
Section E The bar chart below shows the number of students that passed STATlS in 2013, 2014 and 2015. I BSc g Other I Commerce 11100 1200 1200 1000 300 300 E00 600 If a student is randomly chosen, what is the probability that they were doing a BSc degree? 600 -.r _r .u . _. _. . . _. _,. |||||ll||l||l||ll| 2015 Question 11 Question 12 If a student is randomly chosen, what is the probability that they did not pass in 2014 or 2015? Question 13 If a student is randomly chosen, what is the probability that they were studying a commerce degree and passed in 2014
Step by Step Solution
There are 3 Steps involved in it
1 Expert Approved Answer
Step: 1 Unlock

Question Has Been Solved by an Expert!
Get step-by-step solutions from verified subject matter experts
Step: 2 Unlock
Step: 3 Unlock